Download
1 / 22
220 likes | 366 Vues
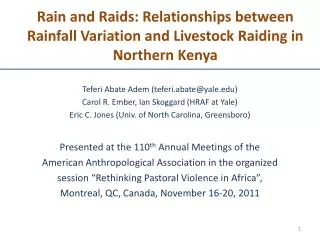
Spatial Distribution of Livestock Raiding in Northern Kenya. Teferi Abate Adem (teferi.abate@yale.edu) Carol R. Ember, Ian Skoggard (HRAF at Yale) Eric C. Jones (Univ. of North Carolina, Greensboro) Presented at the Annual Meeting of the Society for Applied Anthropology ( SfAA )

E N D
Spatial Distribution of Livestock Raiding in Northern Kenya Teferi Abate Adem (teferi.abate@yale.edu) Carol R. Ember, Ian Skoggard (HRAF at Yale) Eric C. Jones (Univ. of North Carolina, Greensboro) Presented at the Annual Meeting of the Society for Applied Anthropology (SfAA) Baltimore, March 28-31, 2012
Rain and Raids in Turkanaland: Temporal Links Our previous research found a strong link between rainfall variability and intensity of livestock raids: human casualties increase in drought years, dry months and drier-than-usual months. This is opposite from what Witsenburg and Adano (2010) found in Marsabit district: Casualties peak in the main rain season (when water and pasture are abundant) and drop in the dry season (when resources dwindle.)
How about Spatial Variability? Does frequency of livestock raids and resulting casualties fluctuate across space too? If so, what is the spatial pattern? What accounts for this variability?
Turkana Herding Strategies • Nilotic-speaking pastoral people in NW Kenya. • Lose livestock to droughts, disease, and raids. • Risk minimizing strategies include species diversification and moving frequently..
Migration in Southern Turkanaland Their moves have a clear geographic pattern: • Normal years – between wet and dry season camps • Drought years – greater distance and frequency to access patches of highly productive drought reserves.
Methods: Sampling Procedure Source database: LexisNexis Academic (http://www.lexisnexis.com/hottopics/lnacademic/ Source categories: Newsletters, Aggregate News Sources, News Transcripts, Newswires, Major Newspapers Time period: 1998-2009 Search: All news reports involving “Tur*ana” Results: Initial search typically yielded about 500 reports per year.
Methods: Data Collection Selected reports if all of the following were satisfied: Socially-organized violence of some kind involving Turkana, either as attackers or attacked Occurred in Turkana district or territories bordering Turkana Involved actual or attempted raid of livestock Data collected from reports: date and place of incident ethnic or state groups involved number of deaths
Methods: Rainfall and Geographic Data Sources • All measures of rainfall are constructed from meteorological data on 0.25 square degree (approximately 30 square kilometers) quadrants by month and year from 1998-2009. Data obtained from the NASA Tropical Rainfall Measuring Mission (TRMM) 3B43. • Landform and standing water from Geonames database (http://www.geonames.org) • Rivers and other smaller watercourses from DIVAGIS (http://www.diva-gis.org)
Methods: Placing Reported Raids on GIS-based Map • Place names in news reports are used to estimate latitude/longitude of raid locations. • Incidents are then assigned a quadrant. • Centroid of quadrant is used to place a violence episode. • 82% of incidents are located to specific places; 9% to Location level and 9% to Division level-- locations with greater degrees of approximation (District level) were omitted.
Analysis of Spatial Variations Do blocks with less annual rainfall variability have more livestock related incidents & human casualties? (We expected that Turkana in dry times try to go to better rainfall areas.) How about other water features such as rivers and seasonal streams? What landform features predict more incidents and deaths? Our analyses are mostly exploratory with the GIS features.
Results In a preliminary analysis, we are better able to predict livestock related incidents than the number of deaths. Results are somewhat different inside Turkana district than outside Turkana district. Here we concentrate on inside Turkana district.
Land forms and relationship to number of livestock-related incidents and deaths in quadrant (Pearson r’s)
Water forms/rain and relationship to livestock-related incidents and deaths in quadrant (Pearson r’s) †p<.10; *p<.05; **p<.01; ***p<.001 (all two-tailed)
Yearly coefficient of variation and raids and raid intensity within quadrants
Conclusions • What do these findings say about links between spatial (as opposed to seasonal) variation in resource context and dynamics of livestock raids in Turkanaland? • Violence more likely in areas with water (pasture/watering) • These areas may be near the drought reserves that are more dangerous to be around (nearness to attackers and predictable need of reserves) • Worth investigating specific cases for plains near mountains, and nearness to roads
Acknowledgements This research was supported by the Office of Naval Research ONR under MURI grant no. N00014-08-1-0921 to George Mason University with a subaward to the Human Relations Area Files (PI: Claudio Cioffi-Revilla; co-PIs: Carol R. Ember, Sean Luke, and Kenneth De Jong). The opinions, findings, and results are those of the investigators and do not reflect the views of the sponsors. • We specifically thank: • A.J. Faas for summarizing statistics across all the data points from the GIS,cleaning data, identifying the grid blocks for Turkana territory, and preparing the GIS and maps. • AtesmachewHailegiorgis and Chenna-Reddy Cotla for extracting rainfall data from NASA which is archived and distributed by the Goddard Earth Sciences Data and Information Services Center. • Sophie Skoggard, for her work collecting and summarizing violent episodes from LexisNexis. • Kate Cummings for entering the data into a database. • Brittany Burke for helping to locate places of conflict from Google Earth, and cleaning data. Current HRAF Team: Carol R. Ember (co-PI), Teferi Abate Adem, Ian Skoggard, and Eric C. Jones.