Download
1 / 16
160 likes | 260 Vues
Modeling of Atmospheric Nitrogen Deposition to the Escambia Bay and Watershed. Krish Vijayaraghavan, Rochelle Balmori, Shu-Yun Chen, Prakash Karamchandani and Christian Seigneur AER, San Ramon, CA Justin T. Walters and John J. Jansen Southern Company, Birmingham, AL Eladio M. Knipping

E N D
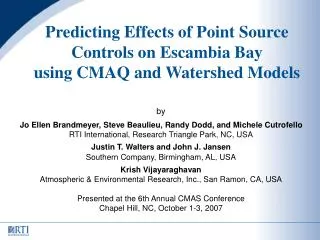
Modeling of Atmospheric Nitrogen Deposition to the Escambia Bay and Watershed Krish Vijayaraghavan, Rochelle Balmori, Shu-Yun Chen, Prakash Karamchandani and Christian Seigneur AER, San Ramon, CA Justin T. Walters and John J. Jansen Southern Company, Birmingham, AL Eladio M. Knipping EPRI, Palo Alto, CA CMAS Conference, Oct 1-4, 2007 Chapel Hill, NC
Overview • Objective • Estimate impact of NOx and SO2 controls at the Crist power plant on nitrogen deposition in Escambia Bay and its watershed in Florida/Southern Alabama • Tools • Three versions of CMAQ v. 4.5.1
Escambia Bay Escambia Bay and Watershed Escambia Bay Watershed
Air Quality Models • CMAQ • CMAQ v. 4.5.1 with SOA modifications by VISTAS • CBM-IV for gas-phase chemistry • AERO4 aerosol module • Heterogeneous nitrate formation in the PM phase only • Includes sea salt emissions but does not account for coarse nitrate formation due to sea-salt/HNO3 interactions • CMAQ-MADRID • Based on CMAQ 4.5.1 and also utilizes CBM-IV • Aerosols: Model of Aerosol Dynamics, Reaction, Ionization, and Dissolution • Heterogeneous nitrate formation in aqueous and PM phase • Comprehensive sea-salt/HNO3 chemistry (fine and coarse size ranges) • CMAQ-MADRID-APT • Builds upon CMAQ-MADRID • Advance Plume Treatment (APT) for 40 power plants, including Plant Crist
Plume Chemistry & Dispersion Relevance to Nitrogen Chemistry 3 2 Early Plume Dispersion 1 Long-range Plume Dispersion Mid-range Plume Dispersion NO/NO2/O3 chemistry Reduced VOC/NOx/O3 chemistry Slow PM formation from OH and NO3/N2O5 chemistry Negligible PM formation Full VOC/NOx/O3 chemistry PM and O3 formation (NO3-, SO4=)
ALGA Modeling Domain 2002 reference year • 12 km horizontal grid resolution • 19 layers up to 15 km altitude • 40 power plants, including Plant Crist, with APT • Inputs from VISTAS/GEPD
Emission Reductions at Plant Crist • Anticipated emission reductions due to installation of FGD and SCR/SNCR
Nitrogen Species * Coarse mode not present for CMAQ
CMAQ CMAQ-MADRID CMAQ-MADRID-APT Spatial Distribution of Total Nitrogen Deposition Change in annual dry + wet deposition flux due to controls on Plant Crist Maximum reduction in deposition flux 0.68 kg/ha 0.85 kg/ha 0.42 kg/ha APT: Less oxidation of NOx to HNO3 => Less dry deposition near the plant
Dry Deposition of Nitrogen over the Escambia Bay Watershed (tpy) • Highest contributor: Gas I-NOz (mostly HNO3)
Ammonia Dis-benefit due to SO2 Controls • SO2 controls => Less PM ammonium sulfate => More gas NH3 • Dry deposition velocity of gas NH3 > PM NH4+ • Increase in NH3 deposition >> Decrease in PM NH4+ deposition Outcome • Planned controls result in an increase in the NHx component of nitrogen deposition. Caveat • Downward revision of the NH3 dry deposition velocities will decrease the dis-benefit. Difference between models • APT has less dis-benefit because of less sulfate formation in the plume.
Sea-salt Dis-benefit due to NOx/SO2 Controls • MADRID and APT account for coarse NaNO3 formation from sea-salt/HNO3 • SO2 controls => Less fine and coarse sodium sulfate • Less coarse sodium sulfate => More coarse sodium nitrate Outcome • Planned controls result in a small increase in coarse nitrate deposition. Caveats • There is enough HNO3 so coarse nitrate formation is not affected by NOx controls. • Dis-benefit will be lower if more fine NaCl in sea-salt emissions • CMAQ will also exhibit sea-salt dis-benefit if it accounts for coarse NaNO3. Difference between models • APT has less dis-benefit than gridded models because of less sulfate/nitrate formation.
Wet Deposition of Nitrogen over the Escambia Bay Watershed (tpy) • Models can not distinguish between gas and PM wet deposition • Largest contributors: I-NOz followed by NHx
Conclusions • Three versions of CMAQ were used to estimate the decrease in atmospheric nitrogen deposition in Escambia Bay/watershed due to NOx and SO2 emissions controls at the nearby Crist power plant. • Differences in results between the three models are due to differences in model formulation and configuration • CMAQ-MADRID has more comprehensive heterogeneous nitrate and coarse sea-salt nitrate chemistry than CMAQ. • CMAQ-MADRID-APT includes plume-in-grid treatment of large point sources (here, 40 large power plants including Crist).
Conclusions • Gaseous inorganic NOz (mostly HNO3) has the largest contribution (~60%) to nitrogen dry deposition in all three models. • Inorganic NOz (gaseous + particulate) is the largest contributor (~52%) to wet deposition with a slightly lower contribution from NHx. • NOx emission controls result in reductions in nitrogen deposition but SO2 controls result in an increase in nitrogen deposition due to an “ammonia dis-benefit”. NH3 dry deposition velocities in CMAQ need to be investigated further.
Conclusions • Over Escambia Bay and its watershed, CMAQ, MADRID and APT predict: • total N deposition reductions of 91, 100, and 106 tons/yr, respectively. • maximum reductions in gridded deposition fluxes of 0.68, 0.85, and 0.42 kg/ha/yr, respectively. • APT simulates less dry deposition of HNO3 and PM sulfate near Plant Crist than CMAQ and MADRID due to its correct treatment of plume dispersion and chemistry. It is important to use a plume-in-grid treatment of emissions from large elevated point sources so that nitrogen deposition can be correctly simulated. • Air quality modeling results were subsequently used in a watershed modeling study to estimate net nitrogen loading to Escambia Bay.