Download
1 / 6
60 likes | 215 Vues
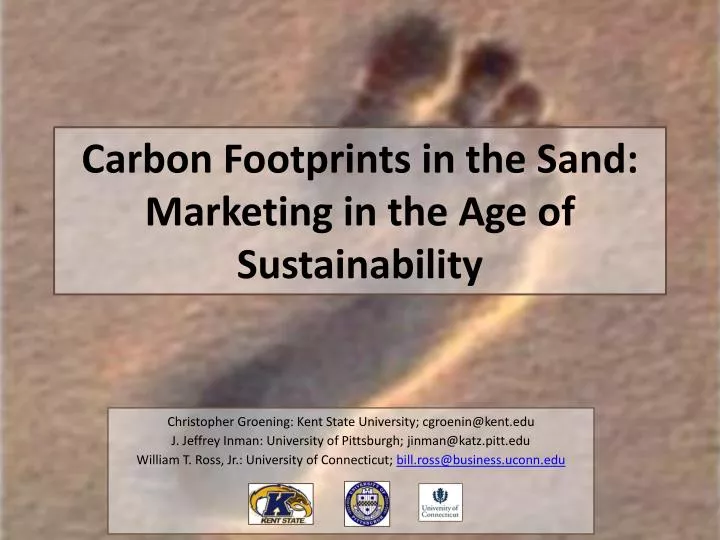
Carbon Footprints in the Sand: Marketing in the Age of Sustainability. Christopher Groening: Kent State University; cgroenin@kent.edu J. Jeffrey Inman: University of Pittsburgh; jinman@katz.pitt.edu William T. Ross, Jr .: University of Connecticut; bill.ross@business.uconn.edu.

E N D
Carbon Footprints in the Sand: Marketing in the Age of Sustainability Christopher Groening: Kent State University; cgroenin@kent.edu J. Jeffrey Inman: University of Pittsburgh; jinman@katz.pitt.edu William T. Ross, Jr.: University of Connecticut; bill.ross@business.uconn.edu
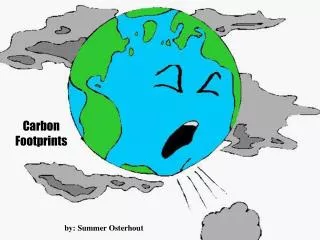
Introduction Carbon footprint of product = Amount of carbon dioxide emitted during • Manufacture (e.g., toys, deodorant) • Transportation (e.g., Fiji water, Ethiopian coffee) • Usage (e.g., car, lawnmower, air conditioner) • Disposal (e.g., fluorescent light bulbs, batteries, computers) Sustainability = Improvement of human life with minimizing the impact on society and the environment
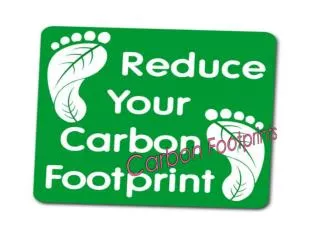
What if Products had a Carbon Footprint Label? Product size is a standard quantity/amount set by industry for that particular product type. The amount of carbon emitted into the atmosphere due to the process of creating, distributing, using, and disposing of the product. Product size is a standard quantity/amount set by industry for that particular product type. Amount of carbon is measured by grams or kilograms. Product usage is for the entire lifetime of the product. The amount of carbon emitted into the atmosphere due to the process of creating, distributing, using, and disposing of the product. Amount of carbon is measured by grams or kilograms. Product usage is for the entire lifetime of the product. Carbon Footprint Product Size: 1 Bottle (20oz) Emissions: +115g - Manufacture: +30g - Transportation: +50g - Product Usage: +25g - Disposal: +10g Offsets: (-50g) - Recycling (-20g) - Carbon Sinks (-30g) Net Emissions : +65g Footprint rating: 2.5/4 FAIR Offsets are the total amount of carbon being eliminated from the atmosphere due to industry accepted initiatives. Recycling is if the product is recycled at the end of usage rather than disposed of in a landfill. Carbon sinks are ways to offset carbon emissions (e.g., preserving Amazonian rain forest). • Offsets are the total amount of carbon being eliminated from the atmosphere due to industry accepted initiatives. • Recycling is if the product is recycled at the end of usage rather than disposed of in a landfill. • Carbon sinks are ways to offset carbon emissions (e.g., preserving Amazonian rain forest). Ratings are created by using the industry average for the particular product. Industry average is mean centered to 2/4. Each foot icon represents a positive or negative standard deviation from the industry average. Ratings are created by using the industry average for the particular product. Industry average is mean centered to 2/4. Each foot icon represents a positive or negative standard deviation from the industry average. Ratings are displayed in half-footprint increments and are rounded up. For example, a 2.5 rating would receive a definition of “Fair.” However, the .5 would be represented by a half-foot icon. Footprint ratings: • 0/4 – Excellent • 1/4 – Good • 2/4 – Average • 3/4 – Fair • 4/4 – Poor Ratings are displayed in half-footprint increments and are rounded up. For example, a 2.5 rating would receive a definition of “Fair.” However, the .5 would be represented by a half-foot icon. Footprint ratings: • 0/4 – Excellent • 1/4 – Good • 2/4 – Average • 3/4 – Fair • 4/4 – Poor
Industry Attributes Label Attributes Product Type Reputation Carbon Footprint Label Consumer Preferences Financial Outcomes Firm Firm Attributes Consumer Attributes Peer and Societal Influences Sample Proposition A: Industry concentration will have an inverted U-shaped effect on the level of carbon emissions; firms in moderately concentrated industries will have less carbon emissions than firms in either low or high concentration industries. • Why? • As competition increases, firms may expend more resources on carbon emission reduction activities to differentiate themselves. • But: • Less concentrated industry = Many firms = Fewer slack resources = Harder to work on carbon reduction • Highly concentrated industry = Few firms = Less need to differentiate
Sample Proposition B: When comparing two similar products with the same Offsets, consumers will put more weight on Recycling than on Carbon Sinks. Therefore more consumers will choose A3 over B3. • Why? • Familiarity with Recycling • More difficult to ascertain the veracity of Carbon Sinks
For the complete paper please go to Customer Needs and Solutions Groening, Christopher, J. Jeffrey Inman, and William T. Ross, Jr. (2014), "Carbon Footprints in the Sand: Marketing in the Age of Sustainability," Customer Needs and Solutions, 1 (1), 40-51.