Download
1 / 36
370 likes | 383 Vues
Mapping Soil-Vegetation-Landscape Relationships Wind River Range, Wyoming. Brian McMullen M.S. Soil Science. Overview of Location and Project Objectives Maps and Analysis Future Work for Project. Introduction. Terrestrial Ecosystems Unit Inventory (TEUI)

E N D
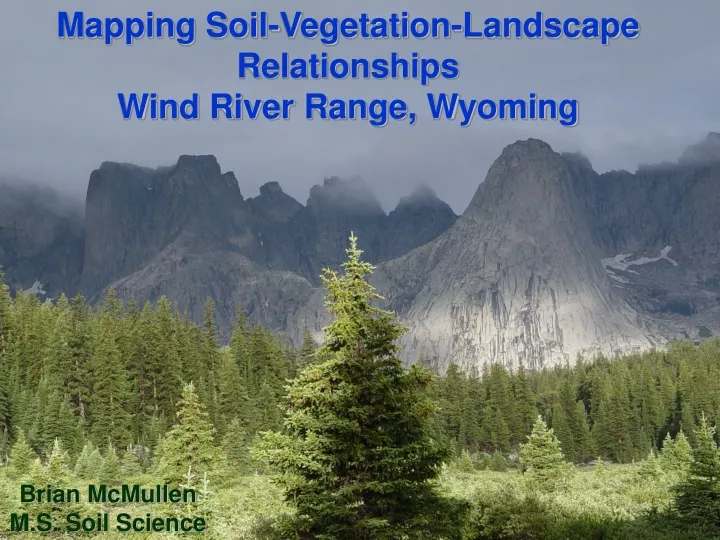
Mapping Soil-Vegetation-Landscape Relationships Wind River Range, Wyoming Brian McMullen M.S. Soil Science
Overview of Location and Project • Objectives • Maps and Analysis • Future Work for Project
Introduction • Terrestrial Ecosystems Unit Inventory (TEUI) • United States Forest Service (USFS) • “…management decisions based on scientific understanding of ecosystems on and surrounding National Forest lands” • Comprehensive survey • Soil • Vegetation • Parent Material
Introduction Research Area • Wind River Range – Western WY • Shoshone National Forest, southern portion • Scant soils and vegetation data • Increased management pressures • Higher backcountry use and visitation • Fire ecology • Grazing impacts
Project Overview • 2 field seasons, 253 ecological site descriptions • Wide range of data collected by 2 soil scientists and 2 botanists • Data is first compiled into an Excel Spreadsheet • Data management the most time consuming and ulcer inducing part of project
Project Location Wind River Mountains Logan, UT Image from Google Earth
Continental Divide Image from Google Earth
Objective 1- Creation of Geodatabase for Plot Data • Compilation of 2004 data completed • 2005 data is ~ 60% complete • 25 columns of data inputs x 253 plots = 6325 cells of data • Coffee consumption is up
Database File Converted to Geodatabase, Shapefiles, and Feature Classes
Initial Layers Added to Base Map • Trails • Roads • Water Features
What the Hell is Base Saturation? • Base saturation is the amount of the soils exchange sites (negatively charged sites on soil surface, or CEC [Cation Exchange Capacity]) occupied by basic cations • Base cations include Ca, Mg, K, and Na • Higher levels of exchangeable base cations = greater buffering capacity • Higher levels of exchangeable base cations = more fertile soil
Mapping Base Saturation • Spatial variability of Base Saturation (measured by ammonium acetate method at USU Soil Genesis Lab) • Track influence of mafic dikes in Louis Lake area • Feedback between - soil parent material/landforms • soil properties • vegetation
Base Saturation Data Nearest Neighbor Algorithm ArcGIS Spatial Analyist
Base Saturation Data Inverse Distance Weighting Algorithm ArcGIS Spatial Analyist
Base Saturation Data Kriging Algorithm ArcGIS Spatial Analyist
Clay (%) Distribution by Inverse Distance Weighting Algorithm
Moisture and Temperature Mapping • As time permits, I would like to look at and incorporate: • Snotel Data • PRISM Data • Soil Survey moisture and temperature data from the neighboring locales
Examining SNOTEL data and soil temperature moisture relationships will drive me to drink more than just coffee……