Download
1 / 63
710 likes | 777 Vues
Remote Sensing of Water. Objectives. Briefly discuss importance of water Consider the fundamentals of surface water biophysical characteristics Evaluate the importance of various factors influencing the spectral characteristics of water: Suspended minerals Chlorophyll

E N D
Objectives • Briefly discuss importance of water • Consider the fundamentals of surface water biophysical characteristics • Evaluate the importance of various factors influencing the spectral characteristics of water: • Suspended minerals • Chlorophyll • Dissolved organic matter • Discuss fundamentals of bathymetry • Consider mapping of water temperature using thermal infrared RS • Briefly consider RS of snow • Discuss integrative RS and GIS approach for water quality modeling
Introduction • Earth’s Moisture Inventory • 2.16% in the form of surface freshwater • 2.1461% in ice and glaciers • 0.0132% in freshwater and saline lakes • 0.0006% in atmosphere • 0.0001% in rivers and streams Water covers ~ 74 %of Earth’s surface
Locations of the 152 continuous-record streamflow gaging stations in Virginia in 1998, jointly operated by the USGS and the VA DEQ. http://va.water.usgs.gov/online_pubs/OFR95-713.html In Situvs. Remote Measurements • In situ measurement of various hydrologic parameters (precipitation, water depth, temperature, salinity, etc.) possible at specific locations • Problem: site-specific, not easy to interpolate, difficult to obtain for distant locations
In Situvs. Remote Measurements • RS measurements may provide spatially continuous and extensive information about a variety of hydrologic variables, including: • Water-surface area (streams, rivers, lakes, oceans, etc.) • Water constituents (organic and inorganic) • Water depth (bathymetry) • Water-surface temperature • Snow-surface temperature • Snow-water equivalent • Ice-surface area • Ice-water equivalent • Precipitation • Water vapor
Surface Water Biophysical Traits • Total radiance (Lt) recorded by sensor is a function of EM energy from four sources: • Lp: atmospheric scattering • Ls: water-surface radiance • Lv: subsurface volumetric radiance • Lb: water body bottom radiance • ESun: downwelling solar radiation • ESky: downwelling sky radiation Lp Ls Air-waterinterface = Boundary layer Lv Lb
Spectral Response of Water … • … as a Function of Wavelength • Pure Water • No organic matter • No inorganic matter • Violet to Blue (400-500 mm) • Least amount of absorption andscattering • Best transmission • Green to NIR(500-800 mm) • Significant absorption Molecular scattering of V + B plus significant absorption of G, Y, O, and R cause water to appear BLUE to our eyes
Cozumel Island Palancar Reef SPOTHRV XS Caribbean Sea Band 1 (green) Band 3 (near-IR) Band 2 (red) Spectral Response of Water … • Monitoring the Surface Extent of Water Bodies • Discrimination of Land and Pure Water • Best in near- and mid-IR region (740 – 2,500 nm) • Water bodies = very dark (high absorption of NIR and MIR) • Land surfaces = bright (high reflectance of NIR and MIR)
Spectral Response of Water … • Monitoring the Surface Extent of Water Bodies • Discrimination of Land and Impure Water • More difficult • Near-IR surface reflection • Subsurface volumetric scattering Space Shuttle Photo of the Mississippi River Delta
Spectral Response of Water … • … as a Function of Organic and Inorganic Constituents • Difficult to extract quantitative information about specific water constituents from RS data • Typically done using subsurface volumetric radiance (Lv) • Control atmospheric scattering (Lp), water-surface radiance (Ls), and water body bottom radiance (Lb) • Function of a number of variables …
Spectral Response of Water … • Monitoring Suspended Minerals (Turbidity), Chlorophyll, and Dissolved Organic Matter • Subsurface volumetric radiance (Lv) = Function of: • Concentration of pure water (w) • Inorganic suspended minerals (SM) • Organic chlorophyll a (Chl) • Dissolved organic matter (DOM) • Total amount of absorption and scattering attenuation (c(l)) that takes place in the water column due to each of these constituents
Spectral Response of Water … • Suspended Minerals • Examples: • Silicon, aluminum, iron oxides • Particle sizes: • Clay (3 – 4 mm) • Silt (5 – 40 mm) • Fine sand (41 – 130 mm) • Coarse sand (131 – 250 mm) • Sources: • Eroded materials from land surfaces (croplands, etc.) • Volcanic eruptions • Etc.
Spectral Response of Water … • Suspended Minerals • Case I water (clear, deep ocean water) • Rarely contains suspended minerals > 1 mm in diameter • Concentrated in inland and nearshore water bodies • Monitoring of type, amount, and spatial distribution of suspended minerals important: • Sedimentation of rivers, reservoirs, etc. (indicator of erosion) • Influence on water quality and suitability for human uses • Carrier and storage agent of pesticides, absorbed phosphorus, nitrogen, and organic compounds (indicator of pollution) • Influence on transmission of solar radiation (e.g., may reduce photosynthesis in aquatic vegetation) • Etc.
Spectral Response of Water … • Suspended Minerals • Spectral reflectance = Function of: • Quantity of suspended sediments • Characteristics (e.g., particle size) of suspended sediments • Monitoring typically requires in situ measurements • Non-windy conditions • Secchi disk • Nephelometric turbidity unit
Spectral Response of Water … • Secchi disk • Secchi depth inversely correlated with the amount of suspended material in the water --- subjective method
Spectral Response of Water … • Nephelometric turbidity unit • Passes light through water obtained at various depths to determine its transmission characteristics, which are related to suspended material in the water
Silty (+ lighter) Clayey (+ darker) Spectral Response of Water … • Suspended Minerals • Comparison of spectral reflectance curves of clear water, water with various levels of silty sediments (left), and water with various levels of clayey sediments (right)
Spectral Response of Water … • Suspended Minerals • As suspended sediment load increases … • reflectance in all wavelengths increases • peak reflectance shifts toward longer wavelengths (toward green, red, and NIR) in visible region • Visible wavelengths (580–690 nm) provides info on: • Type of suspended sediments in surface waters • Near-IR wavelengths (714–880 nm) provides info on: • Amount of suspended sediments in surface waters
Spectral Response of Water … • Chlorophyll • Plankton • Generic term used to describe all the living organisms in a water body that cannot resist the current (unlike fish) • Phytoplankton • Plant organisms • Zooplankton • Animal organisms • Bacterioplankton • Bacteria • Algal fungi • Important, e.g., because photosynthesizing plankton convert their habitats (e.g., oceans) into carbon sinks
Spectral Response of Water … • Chlorophyll • All phytoplankton types have different concentrations of chlorophyll a • Appear as different colors to sensitive remote sensors • RS facilitates: • Estimate of amount and general type of phytoplankton in water bodies • Estimate of health and chemistry of water bodies • Changes in the above
Strong absorption in blue and red (2) (1) (3) Reflectance peak in green (4) Spectral Response of Water … • Chlorophyll • Percent reflectance of clear and algae-laden water • Clear water • 4 distinct scattering/ absorption features in algae-laden water: • (1), (2), (3): see left • (4) Reflectance peak: • Caused primarily by algal-cell scattering • Useful for measuring the amount of chlorophyll
Spectral Response of Water … • Chlorophyll • Percent reflectance of clear and algae-laden water • Overall: Increase in chlorophyll concentration causes: • Decrease in the relative amountof energy reflected in R and B wavelengths • Increase in the relative amount of energy reflected in G wavelengths
Shift in peak reflectance from ~550 nm (green) to 600 nm (orange) Spectral Response of Water … • Chlorophyll • Percent reflectance of algae-laden water with various suspended sediment loads (0 – 500 mg/l, red loam)
Spectral Response of Water … • Chlorophyll in Ocean Water • Assumption: • No suspended mineral sediment contamination in Case I Remote estimates of near-surface chlorophyll concentration = Estimates of near-surface biomass or primary productivity • Relationship b/w spectral bands and chlorophyll concentration (Chl): L(l1) and L(l2) = upwelling radiances at selected wavelengths x & y = empirically derived constants
Spectral Response of Water … • Chlorophyll in Ocean Water • Useful satellite remote sensing systems
Spectral Response of Water … • Chlorophyll in Ocean Water • Useful satellite remote sensing systems
Spectral Response of Water … • Chlorophyll in Ocean Water • Useful satellite remote sensing systems
Spectral Response of Water … • Chlorophyll in Ocean Water • SeaWiFS (Sea-viewing Wide Field of View Sensor)
Spectral Response of Water … • SeaWiFS – Some Applications • Examine role of oceans in global carbon cycle • Examine role of oceanic factors in global climate change • Identify magnitude and variability of the annual cycle of primary production by marine phytoplankton • Determine the distribution and timing of spring blooms • Assess dynamics of ocean and coastal currents, the physics of mixing, and the relationships between ocean physics and large-scale productivity patterns • Etc.
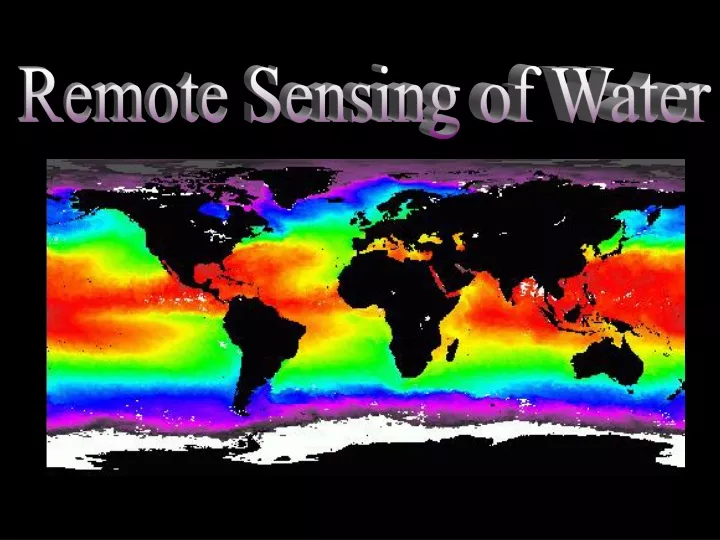
Spectral Response of Water … • SeaWiFS – Some Applications • Global map of chlorophyll a
Spectral Response of Water … • SeaWiFS – Some Applications • Left: True color composite (RGB = 670, 555, 412 nm) • Right: Chlorophyll a concentrations Chlorophyll aconcentrations Reds: high Yellows: intermediate Blues: low
Spectral Response of Water … • Chlorophyll in Coastal and Inland Water • More difficult than in Case I due to effects of suspended sediments and dissolved organic matter (DOM) • Requires: • Atmospheric correction of RS data • Complex multiple-component extraction methodology • Use of derivative spectra technique
Spectral Response of Water … • Dissolved Organic Matter (DOM) • Photic depth • Vertical distance from the water surface to the 1 % subsurface irradiance level • Depth to which sunlight penetrates the water column • DOM • Introduced into oceanic, nearshore, and inland water bodies when: • Phytoplankton consume nutrients and convert them into OM • Zooplankton eat phytoplankton and convert it into OM • Bacterioplankton decompose organic matter
Spectral Response of Water … • Dissolved Organic Matter (DOM) • DOM may reduce photic depth • Decomposition of phytoplankton yields: • Carbon dioxide, inorganic nitrogen, sulfur, phosphorus • Humic substances • Called yellow substances / Gelbstoffe • Impact absorption and scattering of light in water • Change the color of water • (Note: color may also come from plants growing near water bodies; e.g., tannin from eastern hemlock)
Optimum for bathymetry Water Penetration (Bathymetry) • Optimum spectral wavelength to obtain depth info: • 0.48 mm (480 nm) • Minimum absorption • Minimum scattering • Minimum reflectance • Maximum transmission • Sensors for bathymetry: • ~ 0.44 – 0.54 mm band • See subsurface featuresto depths of 10 – 30 m • Requires relatively “pure”water
Water Penetration (Bathymetry) • Problem: • Sun’s light is bent (refracted) from its true course in: • Atmosphere • Water column → Bathymetric (z) info in he imagery is NOT in its proper planimetric (x, y) position → Take into account index-of-refraction (n) (See Chapter 2.) • Measure of the optical density of a substance • Ratio of speed of light in a vacuum (c) to the speed of light in a substance (cn) • Note: c is always greater than cn→n is always greater than 1
Water Penetration (Bathymetry) • Active SONAR sensing: • More frequently used for bathymetric charting than passive RS • SONAR = Sound Navigation Ranging (1) Emit sound from ship toward bottom of water body (2) Measure time it takes for the reflected pulse to be received (3) Correlate this amount of time with water depth • Problematic in shallow water (shallow estuaries, bays, rivers, etc.) • Passive RS still important
Water Penetration (Bathymetry) • Active SONAR sensing: • Causing death of whales and other cetaceans? • See http://news.bbc.co.uk/2/hi/science/nature/3173942.stm • Do sonar signals: • cause bubbles in the animals’ tissues, thereby causing decompression sickness (DCS)? • frighten the whales into making too rapid an ascent, thereby causing decompression sickness (DCS)? • Well … let’s just see at which level of sound this effect can be induced …Ouch!
A Follow-Up on RADAR … • Does RADAR affect the environment? • An Assessment of Potential Health Effects from Exposure to PAVE PAWS Low-Level Phased-Array Radiofrequency Energy (National Academic Press, 2005) • http://www.nap.edu/books/0309093090/html/ • Selected Results: • Intermediate exposure times: • Changes in development and differentiation of tissues and organisms (e.g., delay in development and reduced fertilization of chick embryos) • Long exposure times (multiple years): • Dose- and distance-dependent decrease in tree-ring width • Changes in cell-wall synthesis activity
Water Penetration (Bathymetry) • Active LIDAR sensing: • Most advanced airborne LIDAR bathymetric mapping system: Scanning Hydrographic Operational Airborne Lidar Survey (SHOALS) • Simultaneously fires a NIR and a G pulse of laser light • Much is absorbed but enough is returned for measurement • Maximum extinction (water penetration) depth: ~ 60 m • Bathymetric system:~ 1,000 pulses/sec; 250 nsec pulse length • Terrestrial system:~ 100,000 pulses/sec; 10 nsec pulse length) • Slower b/c shorter laser pulse would be scattered in water
Water Penetration (Bathymetry) • Active LIDAR sensing: • SHOALS • Water depth calculated from time difference b/w the NIR surface & G bottom return and speed of light in air & water • Advantages to acoustic (SONAR) sensors: • Performs well in shallow water (better access) • Allows surveys of hazardous coastal areas (safer) • Mobile (allows rapid response in case of emergency) • Can quickly inventory large areas (more economic) • Disadvantage: • lower extinction depth
Water Penetration (Bathymetry) • Active LIDAR sensing:
Water Surface Temperature • Thermal Infrared RS • Useful to assess surface temperatures during the day and at night • Problem with water bodies (as opposed to land surfaces): • Energy transfer by means of convection → Mixing → Relatively uniform water surface temperature 24/7 → High thermal inertia → Water appears relatively cooler than land during the day → Water appears relatively warmer than land at night
Water Surface Temperature • Daytime vs. Nighttime TIR Image of Atlanta, GA Night Day
Water Surface Temperature • Thermal Infrared RS • Okay for water surface temperature measurements • Not okay for water subsurface temperature measurements • Two important thermal infrared sensors (both on NOAA): • AVHRR (Advanced Very High Resolution Radiometer) • GOES (Geostationary Operational Environmental Satellite) • Used frequently to obtain sea-surface temperature (SST) measurements over oceanic surfaces (IFOV > 1 × 1 km)
Water Surface Temperature • 3-Day AVHRR TIR Composites of the SE U.S. Coast Adjusted to highlight warm Gulf Stream Adjusted to highlight cool coastal water
Water Surface Temperature • 3-Day AVHRR TIR Composite of the SE U.S. Coast