Download
1 / 1
10 likes | 108 Vues
TOVS/AIRS. OPI. Emission Microwave. Scattering Microwave. Merged IR GPI. Microwave/Other Fusion. Microwave/IR Calibration. Matched 3-hr Geo-IR GPI. Gauge-Adjusted Satellite. AGPI. Low-Orbit AGPI. Multi-Satellite. Gauge. Satellite/Gauge.

E N D
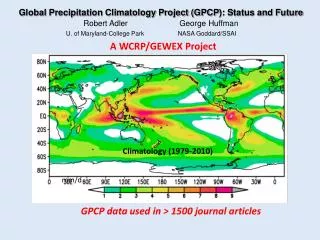
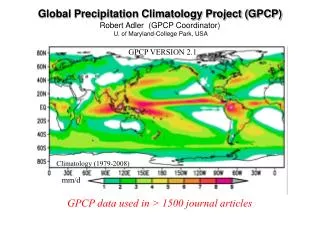
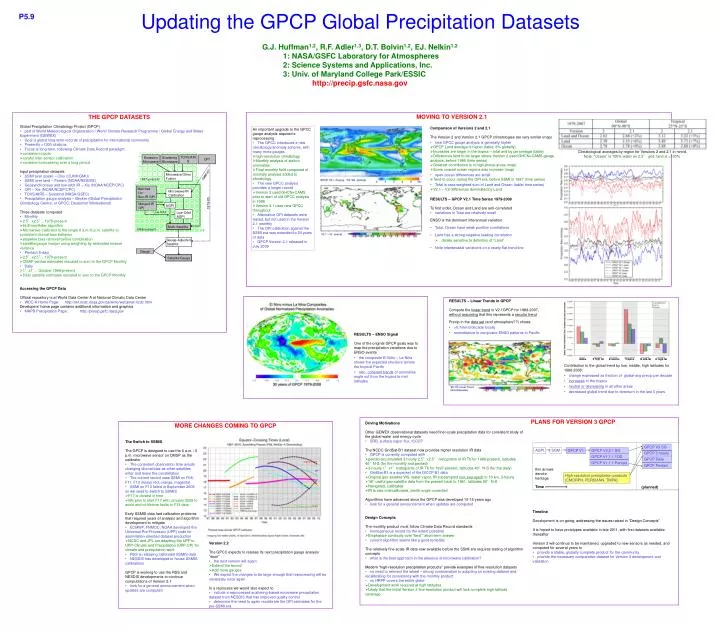
TOVS/AIRS OPI Emission Microwave Scattering Microwave Merged IR GPI Microwave/Other Fusion Microwave/IR Calibration Matched 3-hr Geo-IR GPI Gauge-Adjusted Satellite AGPI Low-Orbit AGPI Multi-Satellite Gauge Satellite/Gauge Updating the GPCP Global Precipitation Datasets P5.9 G.J. Huffman1,2, R.F. Adler1,3, D.T. Bolvin1,2, EJ. Nelkin1,2 1: NASA/GSFC Laboratory for Atmospheres 2: Science Systems and Applications, Inc. 3: Univ. of Maryland College Park/ESSIC http://precip.gsfc.nasa.gov MOVING TO VERSION 2.1 THE GPCP DATASETS Global Precipitation Climatology Project (GPCP) • part of World Meteorological Organization / World Climate Research Programme / Global Energy and Water Experiment (GEWEX) • Goal is global long-term records of precipitation for international community • Presently >1300 citations • Focus is long-term, following Climate Data Record paradigm • consistent inputs • careful inter-sensor calibration • consistent processing over a long period Input precipitation datasets • SSMI over ocean – Chiu (CUHK/GMU) • SSMI over land – Ferraro (NOAA/NESDIS) • Geosynchronous and low-orbit IR – Xie (NOAA/NCEP/CPC) • OPI – Xie (NOAA/NCEP/CPC) • TOVS/AIRS – Susskind (NASA/GSFC) • Precipitation gauge analysis – Becker (Global Precipitation Climatology Centre, or GPCC; Deutscher Wetterdienst) Three datasets computed • Monthly • 2.5°x2.5°, 1979-present • Huffman/Adler algorithm • Microwave calibrator is the single 6 a.m./6 p.m. satellite to ensure consistent diurnal bias behavior • stepwise bias removal before combination • satellite/gauge merger using weighting by estimated inverse error variance • Pentad (5-day) • 2.5°x2.5°, 1979-present • CMAP pentad estimates rescaled to sum to the GPCP Monthly • Daily • 1°x1°, October 1996-present • Daily satellite estimates rescaled to sum to the GPCP Monthly Accessing the GPCP Data Official repository is at World Data Center A at National Climatic Data Center • • WDC-A Home Page: http://lwf.ncdc.noaa.gov/oa/wmo/wdcamet-ncdc.html • Developers’ home page contains additional information and graphics • • MAPB Precipitation Page: http://precip.gsfc.nasa.gov • Comparison of Versions 2 and 2.1 • The Version 2 and Version 2.1 GPCP climatologies are very similar (map) • • new GPCC gauge analysis is generally higher • GPCP Land average is higher (table; 6% globally) • Increases are larger in the tropics – total and by percentage (table) • Differences tend to be larger where Version 2 used GHCN+CAMS gauge analysis, before 1986 (time series) • Greatest contribution is in high-precip areas (map) • Some coastal ocean regions also increase (map) • • open-ocean differences are small • Tend to occur during the OPI era, before SSMI in 1987 (time series) • • Total is area-weighted sum of Land and Ocean (table; time series) • V2.1 – V2 differences dominated by Land RESULTS – GPCP V2.1 Time Series 1979-2009 • To first order, Ocean and Land are anti-correlated • • variations in Total are relatively small • ENSO is the dominant interannual variation • • Total, Ocean have weak positive correlations • • Land has a strong negative leading correlation • details sensitive to definition of “Land” • • Note interdecadal variations on a nearly flat trend line An important upgrade to the GPCC gauge analysis required a reprocessing • The GPCC introduced a new climatology/anomaly scheme, with many more gauges • high-resolution climatology • Monthly analysis of station anomalies • Final monthly field composed of anomaly analysis added to climatology • The new GPCC analysis provides a longer record • Version 2 used GHCN+CAMS prior to start of old GPCC analysis in 1986 • Version 2.1 uses new GPCC throughout • Alternative OPI datasets were tested, but not used in the Version 2.1 monthly • The OPI calibration against the SSMI era was extended to 20 years of data • GPCP Version 2.1 released in July 2009 Climatological averages by region for Versions 2 and 2.1 in mm/d. Note: “Ocean” is 100% water on 2.5° grid; land is <100%. 1986-87 1987-present Geo 1979-85 Low-Orbit 1986-present V2.1 – V2 (mm/d) ‘88-’07 Linear Trend (mm/d/decade) RESULTS – Linear Trends in GPCP Compute the linear trend in V2.1GPCP for 1988-2007, without assuming that this represents a secular trend Precip in the data set (and atmosphere??) shows • >0.7mm/d/decade locally • resemblance to composite ENSO patterns in Pacific RESULTS – ENSO Signal One of the original GPCP goals was to map the precipitation variations due to ENSO events • the composite El Niño – La Niña shows the expected structure across the tropical Pacific • also, coherent bands of anomalies angle out from the tropics to mid-latitudes S high lat Globe S mid-lat Tropics N mid-lat N high lat Contribution to the global trend by low, middle, high latitudes for 1988-2008: • change expressed as fraction of global-avg precip per decade • increases in the tropics • neutral or decreasing in all other areas • decreased global trend due to downturn in the last 3 years PLANS FOR VERSION 3 GPCP Driving Motivations Other GEWEX observational datasets need finer-scale precipitation data for consistent study of the global water and energy cycle • SRB, surface vapor flux, ISCCP The NCDC GridSat-B1 dataset now provides higher resolution IR data • GPCP is currently computed with • pentad-accumulated 3-hourly 2.5°x2.5° histograms of IR Tb for 1986-present, latitudes 40°N-S (for the monthly and pentad) • 3-hourly 1°x1°histograms of IR Tb for 1997-present, latitudes 40°N-S (for the daily) • • GridSat-B1 is a superset of the ISCCP B1 data • Original geo-satellite VIS, water vapor, IR subsampled (not averaged) to 10 km, 3-hourly • “all” useful geo-satellite data from the present back to 1981, latitudes 60°N-S • Navigated, calibrated • IR is also intercalibrated, zenith-angle-corrected Algorithms have advanced since the GPCP was developed 10-15 years ago • look for a general announcement when updates are computed Design Concepts The monthly product must follow Climate Data Record standards • homogeneous record (to the extent possible) • Emphasize continuity over “best’” short-term answer • • current algorithm seems like a good template The relatively fine-scale IR data now available before the SSMI era requires testing of algorithm concepts • what is the best approach in the absence of microwave calibration? Modern “high-resolution precipitation products” provide examples of fine-resolution datasets • no need to reinvent the wheel – strong consideration to adopting an existing dataset and recalibrating for consistency with the monthly product • no HRPP covers the entire globe • Development work required at high latitudes • Likely that the initial Version 3 fine-resolution product will lack complete high-latitude coverage MORE CHANGES COMING TO GPCP The Switch to SSMIS The GPCP is designed to use the 6 a.m. / 6 p.m. microwave sensor on DMSP as the calibrator • The consistent observation time avoids changing diurnal bias as other satellites enter and leave the constellation • The current record uses SSMI on F08, F11, F13 (heavy red, orange, magenta) • • SSMI on F13 failed in September 2009, so we need to switch to SSMIS • F17 is closest in time • We plan to start F17 with January 2009 to avoid end-of-lifetime faults in F13 data Early SSMIS data had calibration problems that required years of analysis and algorithm development to mitigate • ECMWF, FNMOC, NOAA developed the Universal Pre-Processor (UPP) code for assimilation-oriented dataset production • NCDC and JPL are adapting the UPP to UPP-Climate and Precipitation (UPP-CP) for climate and precipitation work • • RSS is releasing calibrated SSMIS data • • NESDIS has developed in-house SSMIS calibrations GPCP is working to use the RSS and NESDIS developments to continue computations of Version 2.1 • look for a general announcement when updates are computed GPCP V3 SG AGPI SGM GPCP V1 GPCP V2,2.1 SG GPCP 3-hourly GPCP V1,1.1 1DD GPCP Daily GPCP V1,1.1 Pentad GPCP Pentad thin arrows denote heritage High-resolution precipitation products [CMORPH, PERSIANN, TMPA] Time (planned) Timeline Development is on-going, addressing the issues raised in “Design Concepts” It is hoped to have prototypes available in late 2011, with first datasets available thereafter Version 2 will continue to be maintained, upgraded to new sensors as needed, and computed for several years to • provide a stable, globally complete product for the community • provide the necessary comparative dataset for Version 3 development and validation Version 2.2 The GPCC expects to release its next precipitation gauge analysis “soon” • the next version will again • Extend the record • Add more gauges • We expect the changes to be large enough that reprocessing will be necessary once again In a reprocess we would also expect to • include a reprocessed scattering-based microwave precipitation dataset from NESDIS that has improved quality control • determine the need to again recalibrate the OPI estimates for the pre-SSMI era