Download
1 / 24
240 likes | 373 Vues
NASA IDS project meeting: Precipitation and LULC change datasets. Hongjie Xie The University of Texas at San Antonio. March 19, 2009 at Texas A&M, Corpus Christi. Year 1. Downscaled the NEXRDA MPE 4 km to 1 km provided for Liang’s group for modeling. 2004-2007, totally 34,842 hourly data.

E N D
NASA IDS project meeting:Precipitation and LULC change datasets Hongjie Xie The University of Texas at San Antonio March 19, 2009 at Texas A&M, Corpus Christi
Year 1 • Downscaled the NEXRDA MPE 4 km to 1 km provided for Liang’s group for modeling 2004-2007, totally 34,842 hourly data
Guan, Xie, Wilson Submitted to J of Hydrology
Year 2 • Processed NEXRAD Stage IV (2004-2007) • Examined methods for improving NEXRDA accuracy • Started to build the SWAT model for Guadalupe River Bain • Started working on the USGS LULC change dataset
2.1 NEXRAD Stage IV (2004-2007) • Stage IV data of 2004-2007 has been downloaded, processed, aggregated into 3 hourly files, and provided for Liang’s group. • All 3 hourly files were provided in the NetCDF format 22º N to 37º N, and 100º W to 75º W
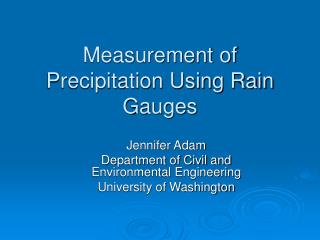
2.2 Improving NEXRDA accuracy • Explored four methods to improve the NEXRDA precipitation accuracy, by incorporating rain gauge measurements • Bias Adjustment (BA) • Simple Kriging with varying Local Means (SKlm) • Kriging with External Drift (KED) • Regression Kriging (RK) • To evaluate which method is better, four evaluation parameters are used: • Percentage Bias, • Mean Absolute Error, • Coefficient of Determination, • Nash-Sutcliffe efficiency
Hour 8, April 24nd, 2004 Hour 8, June 22nd, 2004
Evaluation parameters of predicted areal mean precipitation and precipitation at three rain gauges for the year of 2004
Box-and-whisker plot of the PBIAS, MAE, R2 and NSE values of the 50 rain gauge for four different methods Results show that the average performance of SKlm is similar to or better than the other three methods. -- A paper is in submission
2.3 SWAT model for Guadalupe River Bain • Soil and Water Assessment Tool (SWAT) • DEM, precipitation, temperature, land cover/land use and soil type as input • Use measured water quality data to tune the parameters. • nitrate (NO3), ammonium (NH4), dissolved oxygen (DO), total dissolved phosphorus (TDP), phosphate (PO4), total organic carbon (TOC), total nitrogen (TN) and total phosphorus (TP) • Data are getting from the Jim’s group (not yet). • Once well-tuned and calibrated, it can be used to estimate the water quality, which can be used to compare with water quality estimates, from Jim’s empirical modeling approach.
78 stations 90 m DEM were used to delineate the basin and subbasins: 21 subbasins and 226 HRUs (hydrological response units)
Key Procedures • Create SWAT project • Delineate watershed (DEM, basin shapefile) • Define land use/soil/slope data grids (land cover/land use, soil type) • Determine the distribution of HRUs • Define rainfall, temperature and other weather data • Write the SWAT input files • Setup and run SWAT
Water quality calibrationUsing NCDC gauge precipitation as input • Data Source: • rainfall and temperature data 1990-2007 • Water quality data: 1993 – 2007 (daily, monthly or yearly) • Model spin-up: 1990-1992 • Calibration period: 1993-2007 • Calibration parameters: • nitrate (NO3), ammonium (NH4), dissolved oxygen (DO), total dissolved phosphorus (TDP), phosphate (PO4), total organic carbon (TOC), total nitrogen (TN) and total phosphorus (TP)
2.4 LULC change dataset • We examined the USGS LULCC dataset • Landsat 1992 • Landsat 2001 • A preliminary analysis was done in Bexar county • For new changes since 2001, we need MODIS yearly 1 km (we can process them if any group need them)
LULC and Change 1992-2001 • Open water • Urban • Barren • Forest • Grassland/Shrub • Agriculture • Wetlands • NN. Changes
NEXRAD precipitation products • NCDC Level II, III • Level II (base) data • Reflectivity, mean radial velocity, and spectrum width • 1 km x 1 degree • 5 or 6 minutes in rain model and 10 minutes in clear sky mode • Level III products (total 41) • DPA (4.7625 km HRAP grid, hourly, but every 5 or 6 minutes) • RFC Stage I, II, III • Stage I - Hourly digital precipitation (HDP), 4 km • Stage II - HDP merge with gauges • Stage III (or MPE)- Mosaicked Stage II cover a RFC area. MPE since 2004. • NCEP Stage IV • Stage IV– Mosaicked Stage III or MPE for the USA.