Download
1 / 26
260 likes | 379 Vues
Perspectives on . 2008 Crash. 2008 Crash: MacroFinance Perspective. Income & Debt Constraints . Infinite Horizon Economy Budget Constraint: PV Income + PV Debt = Debt Service + PV Consumption “NPG” Condition: PV of Debt over long run = 0 Implications:

E N D
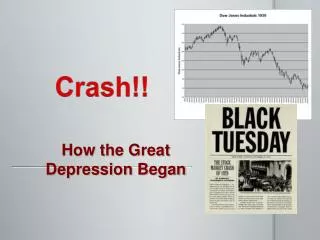
Perspectives on 2008 Crash
Income & Debt Constraints • Infinite Horizon Economy Budget Constraint: PV Income + PV Debt = Debt Service + PV Consumption • “NPG” Condition: PV of Debt over long run = 0 • Implications: • Long Run Income (expected) Pays for Consumption • Revision of expected income leads to revision of sustainability of debt (financial crisis) and restriction of consumption (recession)
Debt-Income Ratio Simulations:How Much is Too Much? Simulation Assumptions: 75-Year Horizons Avg. C/Y = 0.80 (NIPA est) Actual Post WWII Data
“Poster” for Huge Non-Mortgage Debt $11 Billion City Center Project Las Vegas – MGM Mirage Bank Loan/Bond Funded
Why So Much Attention on Mortgage Debt? • Prevailing Wisdom: • Downturn in real estate/mortgage debt caused values in other financial sectors to decline • Alternative Hypothesis: • Mortgage Debt/Real Estate Values More Visible and Quicker to Reflect Weaker Conditions • Markets in real estate and mortgage debt update prices daily • Large Amounts of Mortgage debt “securitized” • CDOs, CMOs traded in marketsable; • Commercial bank loans valued at “PV of expected cash flow” by bank • Not traded, values not updated daily • Nominally, updated quarterly but still reflect bank PV estimates, not market values
Common Explanations • Fed-Created Problems (Taylor, Cochrane, …) • Moral Hazard: Long run problem: Fed guarantees, separating “systemic” v. non-systemic problems and some by instruments that veiled genuine risks (TBTF) • Loose Monetary Policy: Fed supplied too much money to markets in 2002-2005 • Policy Uncertainty: Fed-Treasury created additional uncertainty that turned negative situation into crisis • Macroeconomic Conditions (Hamilton, …) • Short run: Spike in Oil prices 2007-2008 • Long run: huge increases in mortgage debt put system at risk; much more vulnerable to point-of-failure issues • My Take? Macroeconomic Conditions • Long run: Large increases in total debt (not just mortgages) relative to income put system at risk to almost any disturbance of income • Wide variety of contributors, private and public • Debt instruments, foreign capital inflows, leverage ratios, Fannie/Freddie, incentives/mandates for poorly qualified loans, • Moral Hazard story superficially appealing but flawed: Stockholders of financial institutions suffered huge losses, why would they permit “moral hazard” – if they did, this is a corporate governance issue, not just public policy • Loose policy/policy uncertainty rely on questionable interpretation of data
Fed Created “Policy Uncertainty”? Financial Stress Appearing Long Before Sept 08
Role of Policy Uncertainty • Cochrane’s Thesis • Long Run: Existence of Fed creates a moral hazard; greater risk taken • Cochrane: bank run externality requires something like Fed, and some moral hazard • Moral hazard too great because market expects Fed to cover everything (over given size) • BG: Agree but isn’t this tradeoff of having a Fed as Lender of Last Resort (insurer)? • Bullard (STL Fed): charge insurance fee? • Short Run: policy uncertainty is the match • In Sept 08, Fed let’s Lehman fail, saves AIG • Spurs crisis by statements about conditions • BG: Prisoner’s dilemma for Fed
Cheap Credit: Innovations? • Securitization, e.g. CDOs • Pooling mortgage (other debt) risk (CDOs, SPVs) • Credit Insurance • Transferring Risk (CDS) • Cochrane: can shuffle risk around, but not change total amount • Evaluation: • CDOs, CDS actually relatively small versus size of overall debt growth
Marked-to-Market Accounting? • How big of an effect is possible from MTM pricing of banks? • See SEC Dec. 2008 Study www.sec.gov/news/studies/2008/marktomarket123008.pdf • 31% of bank assets MTM • 22% of these impact income statement • Part of this amount in Treasuries • Differences in MTM and “amortized cost” • If 20% difference, then 4.4% impact on income • Currently, using “amortized cost” method • Citi assets increase by apx. $3B (out of $1.2T) • BoA assets increase by apx. $9B (out of $1.4T)
Solutions? • Cochrane: • Specify systemic risk for Fed, limiting TBTF • Stiglitz, … • Limit financial innovation • More stringent oversight • Poole, Bullard, BG, … • Raise equity standards • Limit financial firm size • Charge insurance fee based on size • Explicit size limitations
High Leverage:1920s Equity “Bubble, 2000s Debt “Bubble” • JC: “If we tried to hold equity or corporate debt in highly leveraged entities funded by short-term debt, we would have the same problems. Actually, we did, back in the 1930s.” • “Leverage” often used as synonym for debt, but, equity can be overvalued and lead to financial pinches when it falls in value by large amounts; regardless of debt v. equity, the long run value is PV of income from them (Modigliani-Miller) • Consider 2 Scenarios for City Center (at $10T nominal value) • Case 1: $9T in Shareholder Equity with $1T in bank debt; • Case 2: $1T in Shareholder Equity with $9T in bank debt: • Assume “true” PV of future income = $5T • With project default: • Case 1: Bank takes equity worth $1T • Original shareholders lose $9T • New shares issued worth $4T • Loss in balance sheets = $5T • Case 2: Bank takes equity worth $1T • Shareholders lose $1T • Bank loses $8T in value up front; issues new stock and regains $4T • Loss in balance sheets =$5T • Assessing Safety for financial system? • Long run valuation equal • Case 2 involves an immediate loss of $8T and risks of reissuance; but … • What if in Case 1, shareholders losing $9T default on other payments funding other bank debt or make massive withdrawals of deposits to fund other payment obligations (1920s-30s scenario)
Higher Equity Standards the answer?Modigliani-Miller Theorem: Capital Structure Irrelevance • No difference of debt v. equity (ownership shares) financing of projects if • Asset prices move with statistical independence; • Asset prices are information based without systematic errors; • Taxes treatment of both sources is the same • Bankruptcy treatment of both is the same • No asymmetry of knowledge among borrowers, lenders, shareholders • Implies capital structure matters to the degree that these conditions matter