Download
1 / 27
270 likes | 388 Vues
2008 Macrofinance crash. Explanations & Questions. Stock Crashes in 20 th and 21rst Centuries. U.S. Stock Crashes and Macroeconomic Events. Can Financial Events Cause Macroeconomic Problems?. “Payments crises” (liquidity crises) Debtors (first level) stop payments

E N D
2008 Macrofinancecrash Explanations & Questions
Can Financial Events CauseMacroeconomic Problems? • “Payments crises” (liquidity crises) • Debtors (first level) stop payments • Lenders (first level) income drop, reduce payments on short term loans • Short-term (money market) lenders income drop, reduce payments … • Consumption/Investment effects • Wealth (balance sheet) effects: firms, households reduce consumption/investment as wealth decreases • Debt/Income ratios: solvent firms, household reduce consumption/investment to bring debt to income ratios down
Framework for Thinkingabout Debt and Macro Outcomes • Infinite Horizon Economy Budget Constraint: PV Income + PV Debt = Debt Service + PV Consumption • “NPG” Condition: Over the long run income funds consumption (not debt) • Entire economy faces a budget constraint just as households or government • Sustainable Long Run Relationship: • Income – Consumption – Debt Service >= 0 • Income Growth > Interest Rate on Debt
Mortgage Debt only Part of the Story:Commercial Lending a Bigger Part
Case Study of U.S. Debt $11 Billion City Center Project Las Vegas – MGM Mirage Bank Loan/Bond Funded
1920s Equity “Bubble & 2000s Debt “Bubble”:Same Story, Different Financial Instruments • Whether Debt-instrument (bond, loan) funded or Equity (stock) funded, ultimate value is net revenue stream from project (Modigliani-Miller Theorem) • High Debt or Equity values imply high expected future net revenue • Consider 2 Scenarios for City Center (at $10B nominal value) • Case 1: $9B in Shareholder Equity with $1B in bank debt; • Case 2: $1B in Shareholder Equity with $9B in bank debt: • Actual PV of future net revenue of project = $5T • With project bankruptcy: • Case 1: Bank claims bankruptcy value = $1B • Original shareholders lose $9B • New shares issued worth $4B • Loss in balance sheets = $5B • Case 2: Bank claims bankruptcy value = $1B • Shareholders lose $1B • Bank loses $8B in value up front; issues new stock and regains $4B • Loss in balance sheets = $5B • In both cases, assets on balance sheets over-valued by $5T; purchases made with this “leverage”
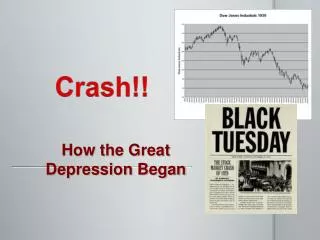
1920s: Stock Valuations Indicating Very High Net Revenues to Make Sustainable
Common Explanations • Long Run Problems: Mortgage markets overvalued • Fed & other gov’t guarantees (moral hazard) pushing mortgage markets • Fed supplied too much money to markets in early 2000sseparating “systemic” v. non-systemic problems • Poor pricing models separating “systemic” v. non-systemic problems pushing too much money into mortgage markets • Short Run Sparks • Uncertainty about Fed reaction • Lack of Fed reaction (2007-08) • Marked-to-market accounting for mortgages
Evaluating “Policy Uncertainty” Thesis:Financial Stress Appearing Long Before Sept 08
Why So Much Attention on Mortgage Debt? • See mortgage debt as leading indicator, not as only cause • Fire analogy: room with fire in it first does not tell you about the fuel and match • Mortgage debt securitized-tradeable; • Quickly reflecting change in valuations • Commercial bank loans non-tradeable; • Held at bank estimated values for longer
Cheap Credit: Innovations? • Securitization, e.g. CDOs • Pooling mortgage (other debt) risk (CDOs, SPVs) • Credit Insurance • Transferring Risk (CDS) • Cochrane: can shuffle risk around, but not change total amount • Evaluation: • CDOs, CDS actually relatively small versus size of overall debt growth
Marked-to-Market Accounting? • How big of an effect is possible from MTM pricing of banks? • See SEC Dec. 2008 Study www.sec.gov/news/studies/2008/marktomarket123008.pdf • 31% of bank assets MTM • 22% of these impact income statement • Part of this amount in Treasuries • Differences in MTM and “amortized cost” • If 20% difference, then 4.4% impact on income • Currently, using “amortized cost” method • Citi assets increase by apx. $3B (out of $1.2T) • BoA assets increase by apx. $9B (out of $1.4T)
Solutions? • Cochrane: • Specify systemic risk for Fed, limiting TBTF • Stiglitz, … • Limit financial innovation • More stringent oversight • Poole, Bullard, BG, … • Raise equity standards • Limit financial firm size • Charge insurance fee based on size • Explicit size limitations
Higher Equity Standards the answer?Modigliani-Miller Theorem: Capital Structure Irrelevance • No difference of debt v. equity (ownership shares) financing of projects if • Asset prices move with statistical independence; • Asset prices are information based without systematic errors; • Taxes treatment of both sources is the same • Bankruptcy treatment of both is the same • No asymmetry of knowledge among borrowers, lenders, shareholders • Implies capital structure matters to the degree that these conditions matter