1 / 1

Fishbone Diagram* for Cause-and-Effect Analysis Using Standards for District Success

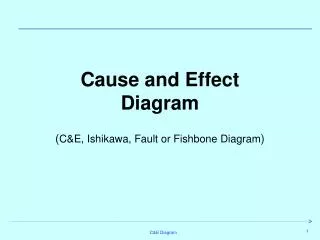
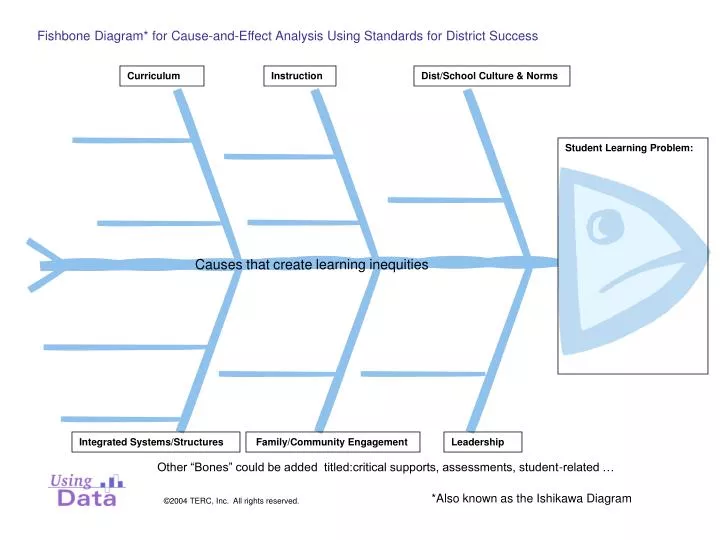
*Also known as the Ishikawa Diagram. Fishbone Diagram* for Cause-and-Effect Analysis Using Standards for District Success. Curriculum. Instruction. Dist/School Culture & Norms. Student Learning Problem:. Causes that create learning inequities. Integrated Systems/Structures .

leigh
Télécharger la présentation

Fishbone Diagram* for Cause-and-Effect Analysis Using Standards for District Success

An Image/Link below is provided (as is) to download presentation Download Policy: Content on the Website is provided to you AS IS for your information and personal use and may not be sold / licensed / shared on other websites without getting consent from its author. Content is provided to you AS IS for your information and personal use only. Download presentation by click this link. While downloading, if for some reason you are not able to download a presentation, the publisher may have deleted the file from their server. During download, if you can't get a presentation, the file might be deleted by the publisher.

E N D

Presentation Transcript


  1. *Also known as the Ishikawa Diagram Fishbone Diagram* for Cause-and-Effect Analysis Using Standards for District Success Curriculum Instruction Dist/School Culture & Norms Student Learning Problem: Causes that create learning inequities Integrated Systems/Structures Family/Community Engagement Leadership Other “Bones” could be added titled:critical supports, assessments, student-related … ©2004 TERC, Inc. All rights reserved.

More Related