Download
1 / 15
210 likes | 1.26k Vues
Leontief Matrix. Robert M. Hayes 2002. Nobel Prize in Economics. The following slides list the persons who have received the Nobel Prize for Economics since its inception in 1969.

E N D
Leontief Matrix Robert M. Hayes 2002
Nobel Prize in Economics • The following slides list the persons who have received the Nobel Prize for Economics since its inception in 1969. • In making the awards, the Prize Committee appears to have attempted to balance several aspects of economic theory: • Market-oriented vs. Public-sector oriented • Quantitative vs. Qualitative
2001 George A. Akerlof, A. Michael Spence, Joseph E. Stiglitz • 2000 James J. Heckman, Daniel L. McFadden • 1999 Robert A. Mundell • 1998 Amartya Sen • 1997 Robert C. Merton, Myron S. Scholes • 1996 James A. Mirrlees, William Vickrey • 1995 Robert E. Lucas Jr. • 1994 John C. Harsanyi, John F. Nash Jr., Reinhard Selten • 1993 Robert W. Fogel, Douglass C. North • 1992 Gary S. Becker • 1991 Ronald H. Coase
1990 Harry M. Markowitz, Merton H. Miller, William F. Sharpe • 1989 Trygve Haavelmo • 1988 Maurice Allais • 1987 Robert M. Solow • 1986 James M. Buchanan Jr. • 1985 Franco Modigliani • 1984 Richard Stone • 1983 Gerard Debreu • 1982 George J. Stigler • 1981 James Tobin • 1980 Lawrence R. Klein
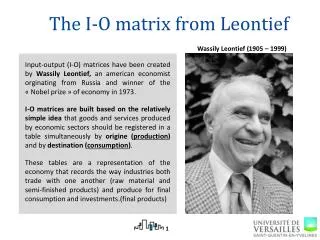
1979 Theodore W. Schultz, Sir Arthur Lewis • 1978 Herbert A. Simon • 1977 Bertil Ohlin, James E. Meade • 1976 Milton Friedman • 1975 Leonid Vitaliyevich Kantorovich, Tjalling C. Koopmans • 1974 Gunnar Myrdal, Friedrich August von Hayek • 1973 Wassily Leontief • 1972 John R. Hicks, Kenneth J. Arrow • 1971 Simon Kuznets • 1970 Paul A. Samuelson • 1969 Ragnar Frisch, Jan Tinbergen
Wasily Leontief • His birth in Germany and move to Russia • His education • His early career • His move to the United States • His appointment at Harvard • His visit to Russia in ? • He is awarded the Nobel Prize in 1973 • He generalizes the Input-Output Model • He moves to NYU in 1975 • His views concerning American economists • His death in 1999
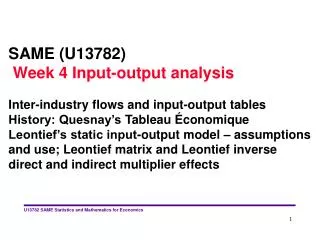
The Impact of Wasily Leontief • The Leontief Matrix • Use in National Defense • Use in Economic Policy • The Motivation • Emphasis on Data rather than Theory • The Potential value of I-O Accounts • Improved Methodology • Supplemental Accounts • His connection with BEA • Bibliography
The Structure of the Leontief Matrix • Sectors • Variables • Matrices • The heart of the idea
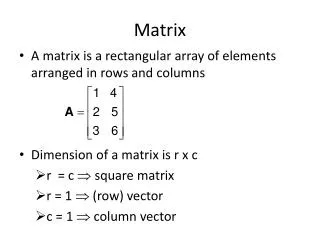
The Fundamental Equation • The fundamental equation is: X = A*X +D where the matrix A represents the requirement for input (from each sector into each sector) that will generate the output to serve the needs in production of output X. The resulting “internal consumption” is represented by A*X. • In the example given above, output vector is X = (1, 1, 1), consumer demand vector is D = (0.5,0.2,0.4) and internal consumption vector is A*X = (0.5,0.8,0.6)
Use of the Fundamental Equation • Let’s suppose that the input-output matrix is constant, at least for a range of consumer demands reasonably close to the given one, which was (0.5,0.2,0.4), from output of (1,1,1). • What would be needed to meet a different consumer demand? • From the basic equation X - A*X = D, the answer requires solving the linear equation (I - A)*X = D, where I is the identity matrix. • In the example, if the consumer demand for sector 3 output were to increase from 0.4 to 0.5, the resulting sector output vector would need to be: (1.0303, 1.0417, 1.1591). The internal consumption (i.e., that output consumed in production) would be (0.5303,0.8417,0.6591), and the difference between the two is (0.5000,0.2000,0.5000).
Dynamic Equation • This becomes really interesting if the production process is viewed as a progression in time. • In static input-output models, the final demand vector comprises not only consumption goods, but also investment goods, that is, additions to the stocks of fixed capital items such as buildings, machinery, tools etc. • In dynamic input-output models investment demand cannot be taken as given from outside, but must be explained within the model. • The approach chosen is the following: the additions to the stocks of durable capital goods are technologically required, given the technique in use, in order to allow for an expansion of productive capacity that matches the expansion in the level of output effectively demanded.
Dynamic Leontief Models • A simple dynamic model has the following form XTt (I - A) - (XTt+1 - XTt )B = DTt, where I is the nxn identity matrix, A is the usual Leontief input matrix, B is the matrix of fixed capital coefficients, X is the vector of total outputs and D is the vector of final deliveries, excluding fixed capital investment; t refers to the time period. It deserves to be stressed that in this approach time is treated as a discrete variable. The coefficient bij in the matrix B defines the stock of products of industry j required per unit of capacity output of industry i and is thus a stock-flow ratio.