Download
1 / 17
170 likes | 324 Vues
AP Human Geography. Demographic Transition Model (DTM). 2.1/ 2.2 Review. Where are the major population clusters? Why do people live and not live in certain areas? What are the different types of population densities? What are CBR, CDR, NIR, TFR, IMR, life expectancy, doubling time?.

E N D
AP Human Geography Demographic Transition Model (DTM)
2.1/ 2.2 Review • Where are the major population clusters? • Why do people live and not live in certain areas? • What are the different types of population densities? • What are CBR, CDR, NIR, TFR, IMR, life expectancy, doubling time?
A note on “Models” • In this class, we will discuss a variety of different models. • Models are examples that help us better understand a major concept or idea. • Models are NOT exact and are flexible. • Models are NOT perfect. • Models might look different in reality than the do in theory.
Example: Christaller’s Model The model The reality
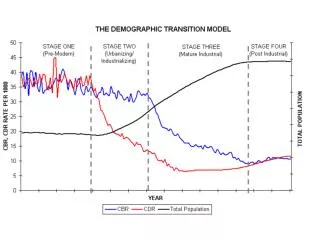
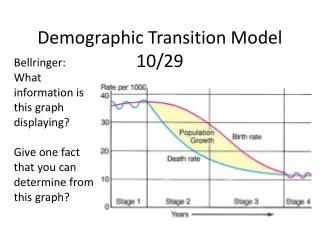
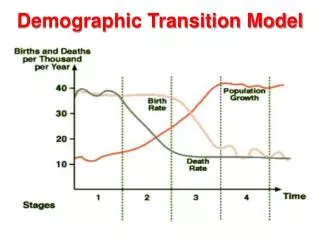
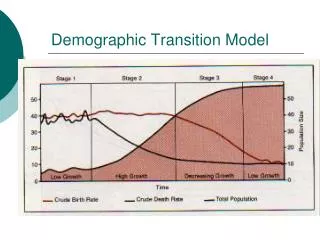
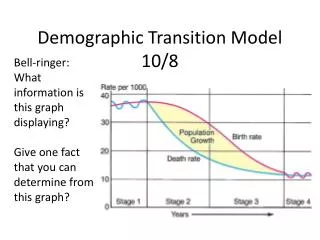
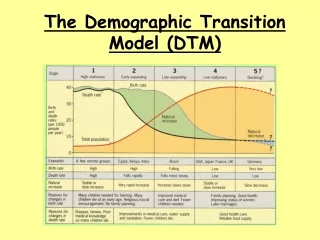
What is the Demographic Transition Model (DTM)? • DTM examines the change in the population within a country over time. • DTM is broken down into 4 stages. • Rates of growth/ decline vary from country to country. • DTM is primarily affected by CBR and CDR. • All countries are in some stage of the DTM.
DTM: Stage 1- Low Growth • WHAT? • Low population growth rate (NIR) • High birth rates • High death rates • WHY? • Epidemics and plagues keep death rates high • Food sources are uncertain (hunting and gathering, basic farming) • Humans have spent most of history in Stage 1 (400,000 B.C. to 1800 A.D.) • No countries are currently in Stage 1
DTM: Stage 2- High Growth • WHAT? • Death rates decline rapidly • Birth rates remain the same • This leads to rapid population growth • WHY? • People are still accounting for high death rates and making lots o’ babies! • Increase in wealth leads to better sanitation, technology (farming), better overall health…people live longer! • First countries entered Stage 2 during the Industrial Revolution (late 1700’s, early 1800’s) • Europe/ N. America enter Stage 2 1800’s but does not reach Africa, Asia, Latin America until the 1950’s (Medical Revolution) • Currently, most of sub- Saharan Africa is Stage 2.
DTM: Stage 3- Moderate Growth • WHAT? • CBR drops rapidly, gets closer to CDR • Population still grows, but much less rapidly • TFR above 2.1 • WHY? • People decide not to have as many children (lower IMR, children are liabilities, not assets) • European/ N. American countries moved from Stage 2 to 3 in the 1950’s • Some Asian/ Latin American countries moved from Stage 2 to 3 recently. (1980’s/ 1990’s)
DTM: Stage 4- Low Growth • WHAT? • Death Rate and Birth Rate are very close/ • NIR close to 0 (zero population growth) • TFR around 2.1 • WHY? • Women enter labor force • Birth control • Increased income/ leisure time • Most European/ NA countries have reached Stage 4.
Possible 5th Stage • WHAT? • Higher death rates than birth rates, irreversible population decline. • TFR below 2.1