Download
1 / 8
80 likes | 296 Vues
Increased snowfall over the Antarctic Ice Sheet mitigated twentieth-century sea-level rise Brooke Medley 1 and Elizabeth Thomas 2 1 Cryospheric Sciences Lab, NASA GSFC , 2 British Antarctic Survey. Figure 1. Figure 2.

E N D
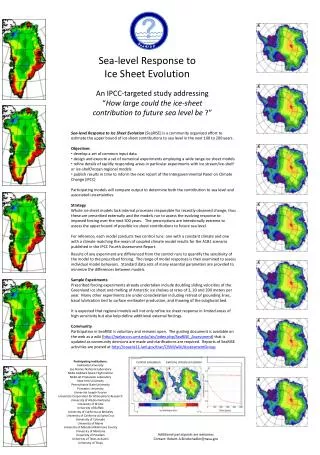
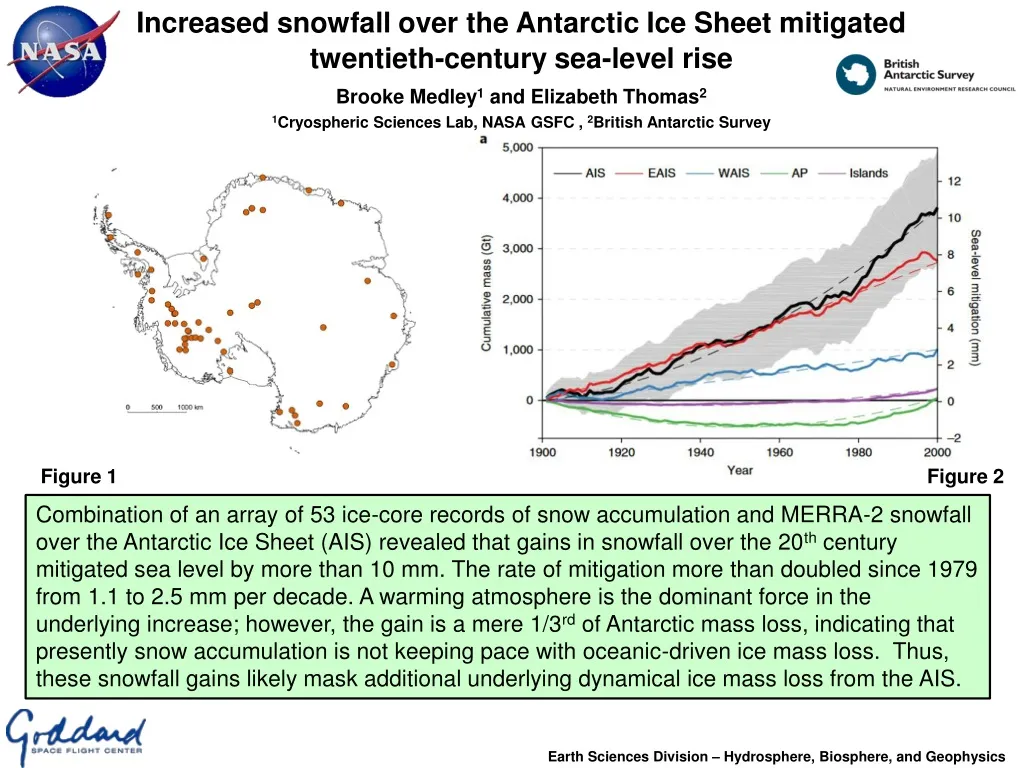
Increased snowfall over the Antarctic Ice Sheet mitigated twentieth-century sea-level rise Brooke Medley1 and Elizabeth Thomas2 1Cryospheric Sciences Lab, NASA GSFC , 2British Antarctic Survey Figure 1 Figure 2 Combination of an array of 53 ice-core records of snow accumulation and MERRA-2 snowfall over the Antarctic Ice Sheet (AIS) revealed that gains in snowfall over the 20th century mitigated sea level by more than 10 mm. The rate of mitigation more than doubled since 1979 from 1.1 to 2.5 mm per decade. A warming atmosphere is the dominant force in the underlying increase; however, the gain is a mere 1/3rd of Antarctic mass loss, indicating that presently snow accumulation is not keeping pace with oceanic-driven ice mass loss. Thus, these snowfall gains likely mask additional underlying dynamical ice mass loss from the AIS. Earth Sciences Division – Hydrosphere, Biosphere, and Geophysics
Name: Brooke Medley, Cryospheric Science Lab, NASA GSFC E-mail: brooke.c.medley@nasa.gov Phone: 301-614-6705 References: Medley, B., and E. R. Thomas. 2018. "Increased snowfall over the Antarctic Ice Sheet mitigated twentieth-century sea-level rise." Nature Climate Change, 9 (1): 34-39 [https://doi.org/10.1038/s41558-018-0356-x] . Data Sources: The MERRA-2 reanalysis climate variables were vital to the published work. We additionally use a database of published ice core records, and the ECMWF ERA-Interim and NCEP CFSR reanalysis products. Technical Description of Figures: The orange dots show the locations of the 53 ice core records used in the snowfall reconstruction over the grounded Antarctic Ice Sheet. On the right, the black line represents the sea level mitigation and equivalent cumulative snow mass gained over the Antarctic Ice Sheet (AIS), East Antarctic Ice Sheet (EAIS), West Antarctic Ice Sheet (WAIS), Antarctic Peninsula (AP), and the islands surrounding the main continent. Thus, the black line represents the entire Antarctic and the colored lines are regional. Grey shading is the 1-sigma uncertainty in Antarctic wide snow mass gains. Figure 1: Locations of the 53 ice core records used to reconstruct 200 years of Antarctic-wide snow accumulation. These records provide the long time history (1801-2000) for the reconstruction while MERRA-2 precipitation fields provide the basis of the spatial interpolation over these records. MERRA-2 only provide precipitation over the satellite era, which is too short to understand change at the ice-sheet scale. Thus, we developed a method to reconstruct Antarctic snowfall through informed combination of the ice cores an spatial coherence patterns in MERRA-2 precipitation. The result is an unprecedented 200-year snow accumulation product over the entire grounded Antarctic Ice Sheet (available for download at the Cryospheric Science Data Portal, https://neptune.gsfc.nasa.gov/csb/index.php?section=518) Figure 2: The cumulative mass and equivalent sea-level change by Antarctic sector over the twentieth century, relative to the nineteenth-century mean. By 2000, Antarctic-wide snowfall mitigated sea level by more than 10 mm (361 Gt = 1 mm sea level). We assumed that snow accumulation over the 19th century represented a long term mean, so the mitigation was determined by integrating the mass gains relative to that mean. Scientific significance, societal relevance, and relationships to future missions: Sea-level rise is of global and societal significance. It is assumed that in a warming world, Antarctica will receive more snowfall. Often climate deniers use this as fuel, suggesting ice sheets will not significantly impact sea level. We prove that while Antarctica is receiving snowfall, it is not even close to keeping pace with ocean-induced ice losses. Net Antarctic mass loss (2,720 Gt) over just 26 years (1992–2017) has accounted for 70% of the century-long snow accumulation gains (3,815 Gt). Long-term changes in snowfall can impact modern-day measured height change from ICESat and ICESat-2; thus, if not properly accounted for, measured height change could be inappropriately converted to mass change. The reconstruction will provide a key data set for evaluation of ice sheet model forcing, constraining projections of the Antarctic contribution to sea-level rise. Earth Sciences Division – Hydrosphere, Biosphere, and Geophysics
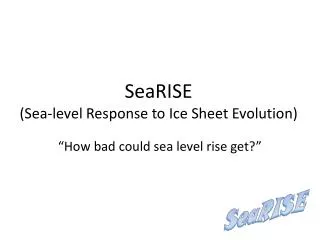
Ground Reflectance Intercomparison at Railroad Valley Playa Kurtis Thome1, Jeff Czapla-Myers2, and Brian Wenny3 1Biospheric Sciences Lab, NASA GSFC, University of Arizona2, 3SSAI Water vapor absorption regions Figure 2 Figure 1 A joint campaign was organized by NASA/GSFC and University of Arizona at Railroad Valley Playa, Nevada May 1 to May 6, 2018 to refine collection approaches and develop guidelines for future surface reflectance intercomparisons and validations. Participants included commercial, education, and government participants from three countries with representatives from the calibration teams of all three Terra imagers. Earth Sciences Division – Hydrosphere, Biosphere, and Geophysics
Name: Kurt Thome, Biospheric Science Lab, NASA GSFC E-mail: kurtis.thome@nasa.gov Phone: 301-614-6671 References: Ong, C., Thome, K., Heiden, U., Czapla-Myers, J. S., & Mueller, A. (2018). Reflectance-Based Imaging Spectrometer Error Budget Field Practicum at the Railroad Valley Test Site, Nevada [Technical Committees]. IEEE Geoscience and Remote Sensing Magazine, 6(3), 111-115. https://doi.org/10.1109/MGRS.2018.2841934 Helder, D., Thome, K., Aaron, D., Leigh, L., Czapla-Myers, J. S., Leisso, N., ... Anderson, N. J. (2012). Recent surface reflectance measurement campaigns with emphasis on best practices, SI traceability and uncertainty estimation. Metrologia, 49(2). https://doi.org/10.1088/0026-1394/49/2/S21 Data Sources: Results will be used to understand the uncertainties for vicarious calibration of earth imagers operating in the solar reflective including ASTER, ETM+, MISR, MODIS, OLI, VIIRS, and current and planned commercial imagers. Technical Description of Figures: Figure 1: Photographs showing the campaign participants from AIST (Japan), DigitalGlobe, NASA/GSFC, NASA/JPL, NGA, University of Arizona, University of Lethbridge (Canada) and several participants collecting data from one of five reflectance samples for intercomparisons. Figure 2: Subset of results showing ratio of retrieved reflectances from a 80 m by 200 m area of the playa surface over three days and using two retrieval approaches. Surface changes were minimal across the different days pointing to instrumental effects and sampling approaches leading to differences on the order of the uncertainties of the Terra sensor’s radiometric total error budgets. Scientific significance, societal relevance, and relationships to future missions: A comprehensive set of valuable data were acquired as part of the campaign that will be useful to answer numerous science questions including: 1) understanding the spatial and spectral homogeneity of the site being measured; 2) understanding the optimal sampling to characterize the site; and, 3) optimization of sampling techniques, including looking into automation of some aspects of the measurement protocols. The comparisons between diffuser-based retrievals of reflectance and the radiance-based retrievals will offer the lessons needed for the calibration and validation of missions such as Landsat and CLARREO Pathfinder and those projects identified in the recent Decadal Survey. Earth Sciences Division – Hydrosphere, Biosphere, and Geophysics
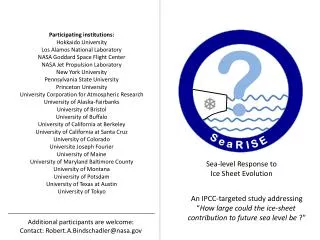
Regularization and Error Characterization of GRACE Mascons Bryant Loomis1 , Scott Luthcke1 , Terence Sabaka1 1 Geodesy & Geophysics Lab, NASA GSFC Figure 1 Figure 2 Regression mass trends (Figure 1) of individual mascons from reduction of GRACE KBRR measurements where colors and grey indicate statistically significant and insignificant land and ice sheet mascons, respectively. Figure 2 shows the global mean sea level (GMSL) budget closure, with total observed change (black), its 90% confidence interval (gray), and GSFC mascon derived total ocean mass and steric components (yellow). Contributions to total ocean mass (dark blue) for Greenland Ice Sheet (green), Antarctic Ice Sheet (orange), Gulf of Alaska (light blue), and all other land (purple) are presented. Earth Sciences Division – Hydrosphere, Biosphere, and Geophysics
Name: Bryant Loomis, Geodesy & Geophysics Lab, NASA GSFC E-mail: bryant.d.loomis@nasa.gov Phone: 301-614-5590 References: Loomis, B.D, S. B. Luthcke, and T. J. Sabaka (2019). “Regularization and error characterization of GRACE mascons,” Journal of Geodesy, 1-18, doi: 10.1007/s00190-019-01252-y. Data Sources: Thirteen years of Gravity Recovery and Climate Experiment (GRACE) satellite-to-satellite microwave ranging data, Level-1B, were analyzed to obtain these results. Total Global Mean Sea Level and Steric component from the WCRP Global Sea Level Budget Group 2018 survey. Technical Description of Figure: Figure 1: Global map of land mascon trends in centimeters water equivalent per annum. The colored mascons indicate the statistically significant mass trends over a 13.5 year span (January 2003 through July 2016), while the gray mascons are those whose trends are determined to be statistically insignificant. Figure 2: Presents the successful closure of the Global Mean Sea Level (GMSL) budget using the ocean mass change solution from the GSFC mascons, and the total GMSL and steric solutions presented in a recent survey of the global sea level budget (WCRP 2018). Over the common data span of 2005.0 – 2016.0, the sum of the full depth steric and GSFC ocean mass trends is equal to 3.69 ± 0.44 mm a-1 , achieving remarkable agreement with the total GMSL trend of 3.70 ± 0.70 mm a-1 . Scientific significance, societal relevance, and relationships to future missions: A new global time-variable gravity mascon solution derived from GRACE Level 1B data is presented. The new solution employs novel approaches to regularization and error estimation. The rigorous treatment of errors is a new and important aspect of the GRACE mascon solution for its science and societal applications. The analysis highlights the successful closure of the global mean sea level budget, that is, the sum of global ocean mass from the GSFC mascons and the steric component from Argo floats agrees well with the total determined from sea surface altimetry. Earth Sciences Division – Hydrosphere, Biosphere, and Geophysics
Analysis of United States Hydrologic Trends • for the National Climate Assessment using NCA-LDAS Michael Jasinski1, J. Borak1,2, S. Kumar1, D. Mocko1,3, C. Peters-Lidard1, M. Rodell1, H. Beaudoing1,2, B. Li1,2, K. Arsenault1,3, H. Rui4, B. Vollmer4, J. Bolten1, and N. Tangdamrongsub1,2 1Hydrological Sciences Laboratory/Code 617, 2UMD/ESSIC, 3SAIC, 4GCDC Mean Annual Precipitation Mean Annual Temperature Mean Annual Net Radiation Figure 1 a) a) b) b) c) c) [K] / decade Mean Annual Evapotranspiration Mean Annual Soil Moisture Mean Annual Snow-Covered Days Figure 2 The National Climate Analysis-Land Data Assimilation System (NCA-LDAS) is an enabling tool for sustained evaluation of terrestrial hydrologic climate indicators over the conterminous U.S. Based on the 36-year (1980-2015) NCA-LDAS reanalysis, several significant trends were discovered, including increasing net radiation and evapotranspiration in the eastern U.S. Also evident were decreased trends in soil moisture in the South and Southwest in response to decreasing precipitation trends, and decreased number of snow-covered days over the entire U.S. due to increased temperature trends. Earth Sciences Division – Hydrosphere, Biosphere and Geophysics
Name: Michael F. Jasinski, NASA GSFC, Hydrological Sciences Lab/Code 617 Email:: Michael.F.Jasinski@nasa.gov Phone: 301-927-3114 • References: • Jasinski, M., J. Borak, S. Kumar, D. Mocko, C. Peters-Lidard, M. Rodell, H. Beaudoing, B. Li, K. Arsenault, H. Rui, B. Vollmer, J. Bolten, and N. Tangdamrongsub, “NCA-LDAS: Overview and Analysis of Hydrologic Trends for the National Climate Assessment”, In revision, Journal of Hydrometeorology, March 2019. • Kumar, S., M. Jasinski, D. Mocko, M. Rodell, J. Borak, B. Li, H. K. Beaudoing, and C. Peters-Lidard, 2018a: NCA-LDAS land analysis: Development and performance of a multisensor, multivariate land data assimilation system for the National Climate Assessment. Journal of Hydrometeorology, https://doi.org/10.1175/JHM-D-17-0125.1. Data Sources: A detailed description of NCA_LDAS is available at https://ldas.gsfc.nasa.gov/NCA-LDAS/. NCA-LDAS time series data products for the continental United States data are available from https://disc.gsfc.nasa.gov/datasets?project=NCA-LDAS. Technical Description of Figures: Significant trend indicators of mean annual hydrologic fluxes and stores were developed from the 36-year NCA-LDAS land reanalysis, that employs the Noah Version 3.3 land surface model forced with NLDAS-2 meteorology, Climate Prediction Center precipitation, and assimilated satellite soil moisture, snow depth and irrigation intensity products. Six example trends from the current version are shown. Figure 1 shows trends in mean annual forcing variables including precipitation (a), temperature (b), and net radiation (c). Figure 2 show trends in mean annual output fluxes and storages including evapotranspiration, total column soil moisture, and snow-covered days. Only grid boxes passing the Mann-Kendall Test at p<0.1 significance are reported. Results illustrate the interrelationship of regional-scale gradients in forcing variable trends, to trends in other land energy and water components. For instance, the combination of the increasing to decreasing trends (from East to West) in precipitation and net radiation (Fig 1a & 1c) are manifested in a similar East-West pattern of evapotranspiration trend, and decreasing soil moisture trend (Fig 2a & 2b). The overall decreasing snow-cover trend (Fig 2c) is related to the overall increasing temperature trend (Fig 1b). Scientific significance, societal relevance, and relationships to future missions NCA-LDAS was created as an end-to-end enabling tool for sustained evaluation and dissemination of physically consistent terrestrial hydrologic indicators. The long-term vision is to optimally combine the full suite of all relevant, past and future, Earth satellite observations to provide high quality data products that support the United States Global Change Research Program goals for sustained climate assessment. NCA-LDAS employs NASA observations within data assimilation modeling to provide improved temporal and spatial trend analysis, especially in regions of sparse in situ data. Over 40 NCA-LDAS data products related to the land water and energy balance are provided in the links identified above. These products are freely available to the public, allowing science and applications communities to formulate other climate indicators for scientific understanding and decision support relevant to hydrology, ecology and other disciplines. Earth Sciences Division – Hydrosphere, Biosphere and Geophysics