Download
1 / 29
330 likes | 619 Vues
Climate Monitoring in Turkey. 3rd Workshop on the Use of Satellite Data for Climate Applications Zagreb, Croatia, 03-07 November 2008. Serhat ŞENSOY Engineer Climatology Division.

E N D
Climate Monitoring in Turkey 3rd Workshop on the Use of Satellite Data for Climate Applications Zagreb, Croatia, 03-07 November 2008 Serhat ŞENSOY Engineer Climatology Division
Energy from the sun drives the earth’s weather and climate, and heats the earth’s surface; in turn, the earth radiates energy back into space. The greenhouse effect is a necessary phenomenon. Without it, earth temperature would be -18°C. But the greenhouse gases trap some of the outgoing energy and maintain Earth’s temperature 15°C. However, too many greenhouse gases could increase in mean temperatures Climate system is comprised by the complicated interactions among the atmosphere, the ocean, the cryosphere, the surface lithosphereand the biosphere.
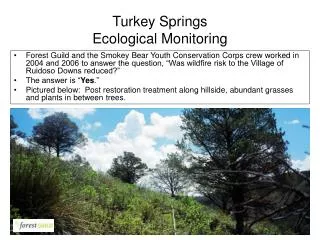
Climate of Turkey • Turkey is located in subtropical zone • It has diverse climatic features; but mainly Mediterranean type • several climatic sub-regions appear • (Black-Sea, Mediterranean, Continental)
What determines climate of Turkey ? • -Geographical Location and General Circulation Patterns • Being a transition zone for air masses and fronts (polar & tropical) • North Atlantic Oscillation (NAO)
Physical Factors complex topographic features high elevation and orientation of mountain chains distance to sea (continentality) A big difference is observed in the total rainfall betweencoastal and inland stations, are compared
1. Monthlyclimate assessments Anomaly is the differences from normal and it is determining by using Z standardized normal distribution (Z=(X-Xmean) /STD). If Z < -0.97 it means that this station value is below normal, if Z is between -0.97 to 0.97, near normal, and if Z > 0.97 it means this value above normal. Calculations have been done by using Excel and ArcGIS is using for interpolation and monitoring purposes
3. Annual climate assessments *This study had been an input in NOAA NCDC Annual Statement
4. Heating and cooling degree-days Heating and cooling degree-day is the unit which useful to indicate how much time cold/warm in the day. Formula: HDD = (18 °C - Tm) x d CDD = (Tm - 22) x d where; Tm = daily mean temp. d= n. of days In the year 2007, heating degree days has been decreased except S. Anatolia Region; while cooling degree days has been increased all over Turkey with parallel to the increased temperature.
5. Climate classification The purpose of classification is to organize a set of data or information about something to effectively communicate it in an informative way. In this study, Aydeniz, Erinç, De Martonne, Trewartha and Thornthwaite method have been used for Turkey climate classification.
10. TREND ANALYSES Annual average precipitation of Turkey for the 1971-2000 climatic periods is about 640mm and has 29mm/100 years decreasing trend. Turkey mean temperature for the 1971-2000 climatic periods is about 13°C and has 0.64°C/100 years increasing trend.
11. Climate Change Detection, Monitoring & Indices Indices software • RClimDex produced on behalf of the ET by Xuebin Zhang from Met. Service of Canada http://cccma.seos.uvic.ca/ETCCDMI/ prec. p.
Trends in N. of summer days (a), tropical nights (b), warm nights(c) and warm days (d)
Contribution to the Global Indices Analyses
12. Extreme event monitoring Small changes in the mean can cause a large change in the likelihood of extreme event.
The highest precipitation amount by measurement at standart times in Turkey.
13. Heat Index Calculation& Monitoring Heat Index Formula: (HI) = -42.379 + 2.04901523(T) + 10.14333127(RH) - 0.22475541(T)(RH) - ((6.83783 x 10⁻³) (T2) - ((5.481717 x 10⁻²)(RH2) + ((1.22874 x 10⁻³)(T2)(RH)) + ((8.5282 x 10⁻⁴)(T)(RH2)) – ((1.99 x 10⁻⁶)(T2)(RH2))
Precipitation Projection, IPCC, AR4 Relative changes in precipitation (in percent) for the period 2090–2099, relative to 1980–1999. Multi model projections show increasing precipitation in the north latitude but decreasing in the Mediterranean. Stippled areas are where more than 90% of the models agree in the sign of the change
Temperature Projection, IPCC, AR4 Projected surface temperature changes for the early and late 21st century. If the PDF is widespread, it means too many extreme event could be occurred.
Thanks for your Attention Serhat Sensoy ssensoy@dmi.gov.tr