Download
1 / 30
300 likes | 411 Vues
Summary of EPA Proposal to Revise the PM NAAQS and Draft WRAP Technical Comments. PM 2.5. Annual primary standard currently 15 ug/m 3 No change in the proposal Taking comment on 13 or 14 ug/m 3 24-hr primary standard currently 65 ug/m 3 Proposal would reduce to 35 ug/m 3

E N D
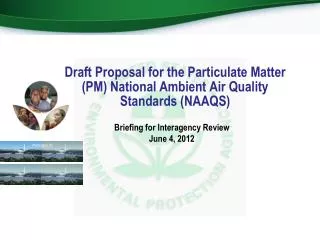
Summary of EPA Proposal to Revise the PM NAAQSandDraft WRAP Technical Comments
PM2.5 • Annual primary standard currently 15 ug/m3 • No change in the proposal • Taking comment on 13 or 14 ug/m3 • 24-hr primary standard currently 65 ug/m3 • Proposal would reduce to 35 ug/m3 • Taking comment on 30-35 ug/m3 • Secondary standards would be equivalent • Taking comment on urban visibility standard of 20-30 ug/m3 averaged over 4-8 daylight hours
PM2.5 • Draft WRAP technical comments support secondary standard for urban visibility • Would have direct benefits to Class I areas impacted by urban areas
PM10 • Proposal would revoke annual standard in all areas • Proposal would revoke 24-hr standard in all areas except in urbanized areas where: • Population is at least 100,000, and • At least one monitor is violating the standard • 24-hr standard would remain in areas above until PM10-2.5 designations occur
Locations where EPA proposes to retain the 24-hr PM10 standard.
Current PM10 nonattainment areas where EPA proposed to revoke the 24-hr standard.
69 PM10 nonattainment and maintenance areas in the WRAP region.
PM10 • EPA taking comment on retaining 24-hr standard in areas with population less than 100,000 • Draft WRAP technical comments support elimination of 100,000 population distinction
PM10-2.5 • PM10-2.5 defined as: • Any ambient mix of PM10-2.5 that is dominated by resuspended dust from high-density traffic on paved roads and PM generated by industrial sources and construction sources. • This definition excludes any ambient mix of PM10-2.5 that is dominated by rural windblown dust and soils and PM generated by agricultural and mining sources. • Agricultural sources, mining sources, and other similar sources of crustal material shall not be subject to control in meeting this standard.
PM10-2.5 • The indicator is not defined or limited to any specific geographic area, but includes a mix of PM10-2.5 in any location that is dominated by these sources. • 24-hr primary standard set at 70 ug/m3 • 3-year average of 98th percentile • No annual primary standard • Secondary standards equivalent to primary • Does this protect visibility?
PM10-2.5 • EPA taking comment on: • Alternative approaches for selecting level of PM10-2.5 standard • Selecting an unqualified PM10-2.5 indicator • Alternative approaches to retaining the 24-hr PM10 standard
Draft WRAP Technical Comments on PM10-2.5 Standard • Eliminate distinction of urban PM10-2.5 • Eliminate exemption for ag, mining, and rural windblown dust • Without eliminating these two provisions, the ability to make reasonable visibility progress in Class I areas will be jeopardized • EPA should adopt a 24-hr PM10-2.5 standard in the range of 50-135 ug/m3
Percentage of IMPROVE sample days between 1997 and 2002 when haze from dust (coarse mass plus fine soil) is the largest component.
Annual PM10-2.5 concentration from the IMPROVE network for 2004.
Average 2002-04 98th percentile PM10-2.5 concentration values for the IMPROVE Network sites.
PM10-2.5 98th percentile concentrations for sites with three year mean values above 30 μg/m3.
Chiricahua NM Typical Visibility Day + 135 ug/m3 of PMcoarse
Chiricahua NM Typical Visibility Day + 100 ug/m3 of PMcoarse
PM10-2.5 Monitoring • Only required in MSAs > 100,000 people • 0-5 sites per MSA • 225-250 sites across 150 MSAs • Emphasis on continuous mass conc. monitors • Additionally … • Non-required PM10-2.5 concentration sites to assess urban/rural differences • 50-100 speciation monitors at urban/rural sites
PM10-2.5 Monitoring • Draft WRAP technical comments • Too little emphasis on non-urban areas • Too little emphasis on speciation • EPA should endorse use of IMPROVEPM10-2.5 monitoring and support speciation of IMPROVE PM10-2.5 samples