1 / 40

Tree Canopy Size and Density Assessment with a Laser Scanner

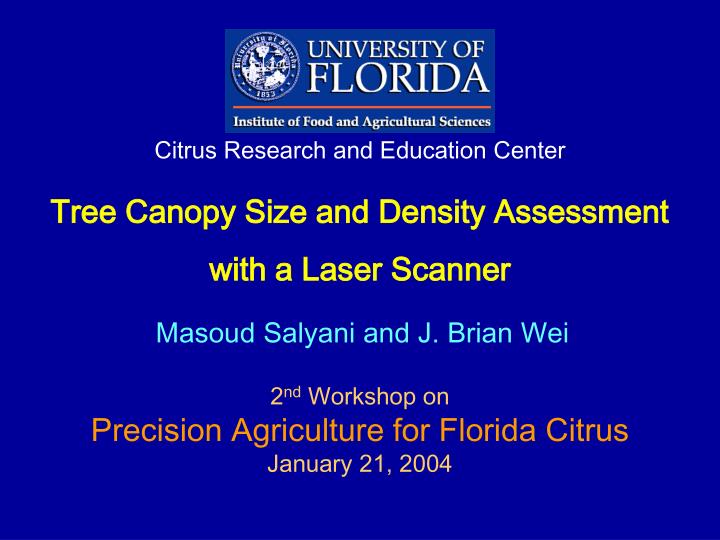
Tree Canopy Size and Density Assessment with a Laser Scanner. Citrus Research and Education Center. Masoud Salyani and J. Brian Wei. 2 nd Workshop on Precision Agriculture for Florida Citrus January 21, 2004. Citrus grove with dead trees and resets. Spray drift. Ultrasonic sensors.

lexiss
Télécharger la présentation

Tree Canopy Size and Density Assessment with a Laser Scanner

An Image/Link below is provided (as is) to download presentation Download Policy: Content on the Website is provided to you AS IS for your information and personal use and may not be sold / licensed / shared on other websites without getting consent from its author. Content is provided to you AS IS for your information and personal use only. Download presentation by click this link. While downloading, if for some reason you are not able to download a presentation, the publisher may have deleted the file from their server. During download, if you can't get a presentation, the file might be deleted by the publisher.

E N D

Presentation Transcript


  1. Tree Canopy Size and Density Assessment with a Laser Scanner Citrus Research and Education Center Masoud Salyani and J. Brian Wei 2nd Workshop on Precision Agriculture for Florida Citrus January 21, 2004

  2. Citrus grove with dead trees and resets

  3. Spray drift

  4. Ultrasonic sensors

  5. Ultrasonic sensors

  6. Ultrasonic sensors

  7. Photocells

  8. Laser sensor

  9. Laser sensor

  10. CREC Laser system in operation

  11. Scanning system principle

  12. Window stop LT Dij Sensor 132.40 LLij+1 Lij+1 Lij I α LLij βj Ө βG Hs βT LG Li2 Li1 II Window start Ground D Scan profile

  13. YT ΔW i+1+ i j j+1 Illustrated in next slide XR XL y YB x (1,1) Schematic view of a Distance image

  14. Pseudo-color image of a tree

  15. A B C D E F G LM HIJK A B C D E F G HIJK LM Spatial resolution test

  16. HIJK A B C D E F G LM Not continuous Continuous image lines Distance image for vertical targets (horizontal resolution)

  17. Not continuous A B C D Continuous E F G HIJK LM Distance image for horizontal targets (Vertical resolution)

  18. A B C D E F G LM HIJK White Black Signal amplitude image for vertical targets

  19. Ground truth of length measurements in three dimensions

  20. Manual vs. laser length measurements Std. dev.

  21. Picture of a test tree

  22. Signal amplitude image

  23. Distance image

  24. Inverted distance image

  25. Original canopy Smoothed canopy Through hole Sensor Lij+1 LLij+1 Shallow gap Lij Ө LLij Deep gap β Hs Ground D Figure 2: Scanning illustration and canopy boundary smoothing Smoothing of canopy boundary

  26. Peak-link algorithm

  27. Distance image – smoothed by peak-link algorithm

  28. Manual Volume Measurement D2a D1a Tree Canopy D2b D1b D2c D1c Ha Hb Hc Ground Hd Level

  29. Manual- and laser-measured volumes Std. dev.

  30. Canopy volume at different heights of trees

  31. Visual vs. laser-measured densities

  32. Corr. bet. Visual and laser-measured densities

  33. Foliage density at north and south sides of trees Std. dev.

  34. Foliage density at different tree heights

  35. User Interface

  36. Amplitude image of one row Processed canopy image of the row

  37. Real-time measurements of one row

  38. Real-time run, 1 mph

  39. Real-time run, 3 mph

  40. Thank you

More Related