Download
1 / 10
780 likes | 1.86k Vues
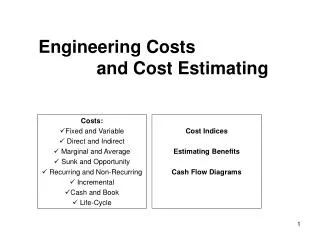
Engineering Costs and Cost Estimating. Chapter 2: Newnan, Eschenbach , and Lavelle Dr. Hurley’s AGB 555 Course. Engineering Cost Concepts. Total Fixed Costs Total Variable Costs Sunk Costs Total Costs Average Total Variable Costs Average Total Fixed Costs Average Total Costs

E N D
Engineering Costs and Cost Estimating Chapter 2: Newnan, Eschenbach, and Lavelle Dr. Hurley’s AGB 555 Course
Engineering Cost Concepts • Total Fixed Costs • Total Variable Costs • Sunk Costs • Total Costs • Average Total Variable Costs • Average Total Fixed Costs • Average Total Costs • Marginal Costs • Opportunity Costs
Engineering Cost Concepts Cont. • Breakeven Point • Profit Region • Loss Region • Profit-Loss Breakeven Chart • Recurring Costs vs. Non-Recurring Costs • Incremental Costs • What is the difference from this and marginal costs? • Cash Costs vs. Book Costs • Life-Cycle Costs
Types of Cost Estimates • Rough Estimates • These estimates are crude and are meant to give you a general idea of the order of magnitude of a project’s cost (e.g., 1,000’s, 10,000’s, 100,000’s, etc.) • These estimates should have a fairly wide error, e.g., -30% to 60% within the actual value of the project’s cost • Very little resources are invested to make these estimates • Semi-Detailed Estimate • These estimates are more refined than the rough estimate • More time is given to identifying specific costs and estimating ranges in the costs • These estimates should have a tighter error than a rough estimate, e.g., -15% to 20% within the actual value of the project’s cost
Types of Cost Estimates • Detailed Estimate • This would be an estimate you make when you are bidding • Considerable time and energy has been spent to get accurate numbers for each cost item • These estimates should have very tight error, e.g., -3% to 5% within the actual value of the project’s cost
Causes of Difficulties in Estimating a Projects Cost • One-of-a-Kind Estimates • May need to do an estimation by analogy • Time and Effort Available • Estimator Expertise
Types of Models for Making Estimates • Per-Unit Model • This is where you take the total cost of the project and divide by the number of units you are dealing with, e.g., per cow, per kWh, per person, etc. • Segmenting Model • The estimates break-up the costs into major components and sub-components • A work breakdown structure is used to decompose the costs • Cost Indexes • These estimates use historical changes in costs, represented by a cost index number, to take a project that has been done in the past where the costs are known to make an estimate of current/future cost of a new project
Types of Models for Making Estimates Cont. • Power-Sizing Model • This model uses historical and current information regarding costs and scaling factors to estimate the cost of equipment or facilities • where x is a sizing factor
The Learning Curve • This concept captures the idea that increasing knowledge of a process will reduce the time necessary to do the process • It can be represented mathematically as: • TN= T1 * Nx , where • TN represents the time required to produce the N unit • T1represents the time required to produce the first unit • N represents the number of units finished • x represents a learning curve exponent
Time-Based Cash Flow Diagram • This is a way of visually representing cash flow for a project either on a diagram or an spreadsheet chart. • Positive values are represented with arrows or bars pointing up, while negative values are represented with arrows that point down • Arrows are placed at different time periods where the time periods can be daily, monthly, quarterly, yearly, or some other meaningful measure of time