Download
1 / 5
50 likes | 54 Vues
COMPARING PROPORTIONS IN LARGE SAMPLES. Examples : Compare probability of H on two coins. Compare proportions of republicans in two cities. 2 populations: p1 =proportion of S in population 1, p2 =proportion of S in population 2.

E N D
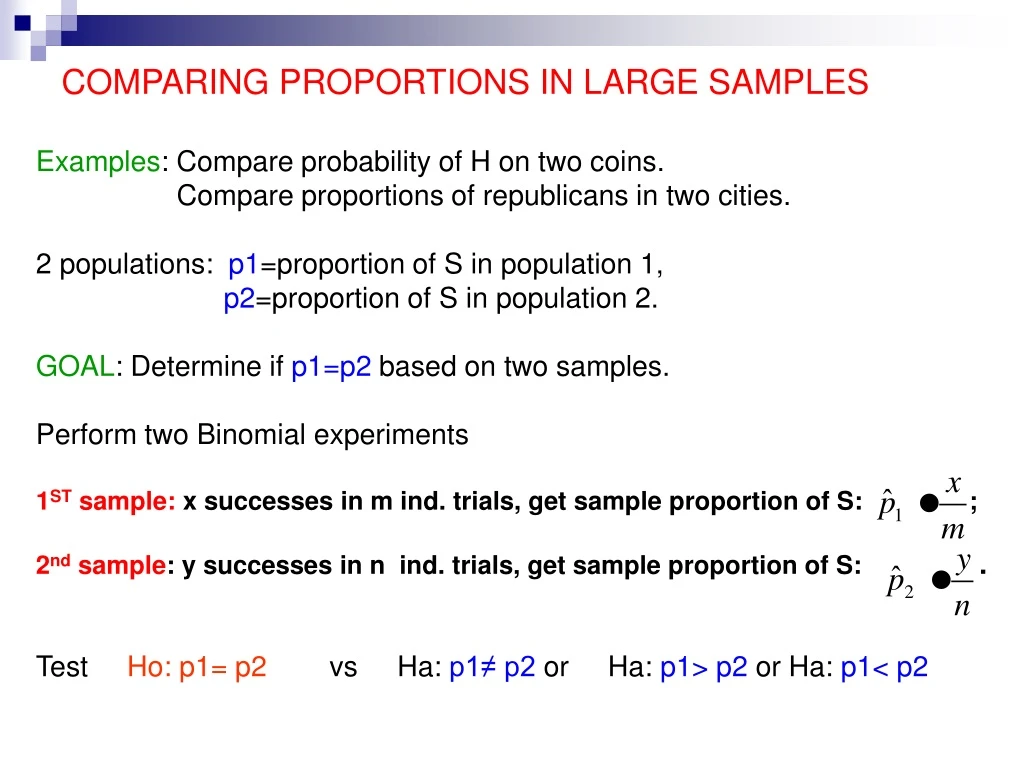
COMPARING PROPORTIONS IN LARGE SAMPLES Examples: Compare probability of H on two coins. Compare proportions of republicans in two cities. 2 populations: p1=proportion of S in population 1, p2=proportion of S in population 2. GOAL: Determine if p1=p2 based on two samples. Perform two Binomial experiments 1ST sample: x successes in m ind. trials, get sample proportion of S: ; 2nd sample: y successes in n ind. trials, get sample proportion of S: . Test Ho: p1= p2 vs Ha: p1≠ p2 or Ha: p1> p2 or Ha: p1< p2
TESTING HYPOTHESIS PROCEDURE Test on significance level α. STEP1.Ho: p1= p2 vs Ha: p1≠ p2 or Ha: p1> p2 or Ha: p1< p2 STEP 2. Test statistic: where, is the “pooled” or combined proportion Under the Ho, the test statistic has standard normal distribution for large samples. STEP 3. Critical value? For one-sided test zα, for two-sided zα/2 . STEP 4. DECISION-critical/rejection region(s) depends on Ha. Ha: p1 ≠ p2 Reject Ho if |z|> zα/2; Ha: p1 > p2 Reject Ho if z > zα; Ha: p1 < p2 Reject Ho if z < - zα. STEP 5. Answer the question in the problem.
EXAMPLE A sample of 180 college graduates was surveyed. 100 of them men and 80 women, and each was asked if they make more or less than $40,000 per year. The following data was obtained. ≥ $40,000 < $40,000 Total Men: 60 40 100 Women: 30 50 100 Total 90 90 180 Are men more likely to make more than $40,000 than women? Use α=0.05. Soln. Let p1= true proportion of men making over $40k; p2= true proportion of women making over $40k;
EXAMPLE, contd. STEP1.Ho: p1= p2 vs Ha: p1> p2 STEP 2. Test statistic: STEP 3. Critical value= zα=z0.05=1.645. STEP 4. DECISION. z = 3 > 1.645, reject Ho. STEP 5. Men are more likely than women to make over $40k.
EXAMPLE contd. Find the p-value for the test P-value = P(Z>z) = P(Z>3) = 0.0013 NOTE. The table on page 194 presents a summary of testing hypotheses formulas for both approaches: critical values and p-values.