Download
1 / 1
10 likes | 78 Vues
A. Lauer, K. Hamilton, Y. Wang, V. Phillips (U. Hawaii), R. Bennartz (U. Wisconsin). Capturing the Year-to-Year Variations in Marine Clouds over the Eastern North Pacific. iRAM (1-yr running mean) iRAM (monthly means) Obs. (1-yr running mean) Obs. (monthly means).

E N D
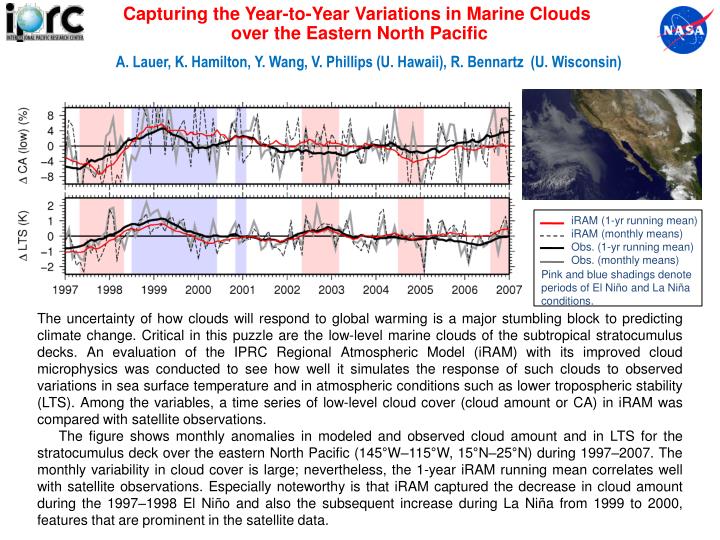
A. Lauer, K. Hamilton, Y. Wang, V. Phillips (U. Hawaii), R. Bennartz (U. Wisconsin) Capturing the Year-to-Year Variations in Marine Clouds over the Eastern North Pacific iRAM (1-yr running mean) iRAM (monthly means) Obs. (1-yr running mean) Obs. (monthly means) Pink and blue shadings denote periods of El Niño and La Niña conditions. The uncertainty of how clouds will respond to global warming is a major stumbling block to predicting climate change. Critical in this puzzle are the low-level marine clouds of the subtropical stratocumulus decks. An evaluation of the IPRC Regional Atmospheric Model (iRAM) with its improved cloud microphysics was conducted to see how well it simulates the response of such clouds to observed variations in sea surface temperature and in atmospheric conditions such as lower tropospheric stability (LTS). Among the variables, a time series of low-level cloud cover (cloud amount or CA) in iRAM was compared with satellite observations. The figure shows monthly anomalies in modeled and observed cloud amount and in LTS for the stratocumulus deck over the eastern North Pacific (145°W–115°W, 15°N–25°N) during 1997–2007. The monthly variability in cloud cover is large; nevertheless, the 1-year iRAM running mean correlates well with satellite observations. Especially noteworthy is that iRAM captured the decrease in cloud amount during the 1997–1998 El Niño and also the subsequent increase during La Niña from 1999 to 2000, features that are prominent in the satellite data.