Download
1 / 1
20 likes | 143 Vues
Applying Astrogrid techniques to the analysis of tissue microarrays. N. A. Walton 1 , J. D. Brenton 2,3 , C. Caldas 2,3 , M. J. Irwin 1 , A. Akram 1 , P. Maccallum 3 , N. Makretsov 2,3 , L. J. Morris 2,3 1 Department of Astronomy, University of Cambridge, Cambridge, UK

E N D
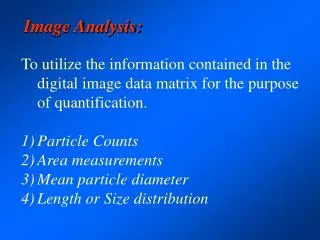
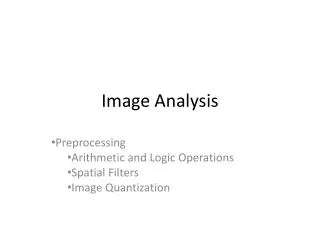
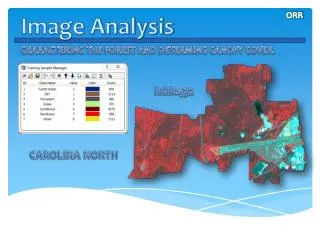
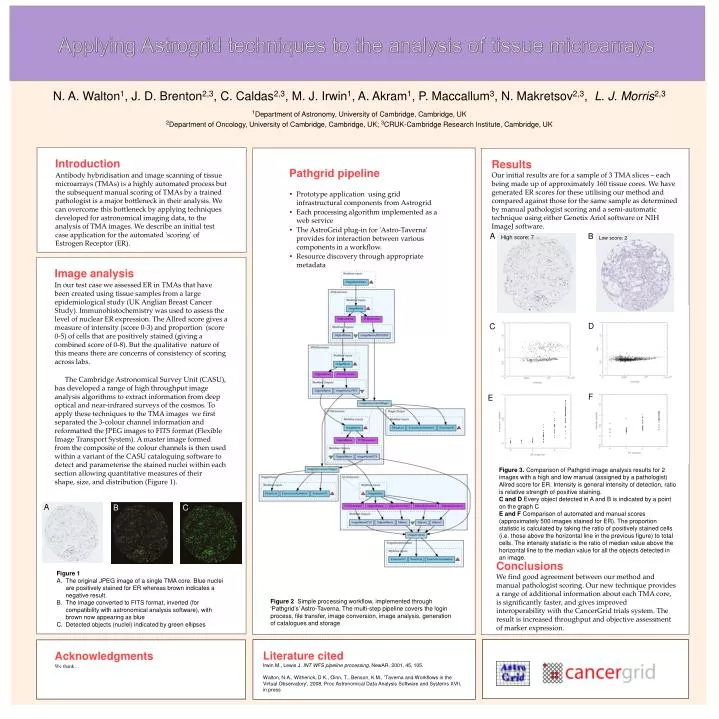
Applying Astrogrid techniques to the analysis of tissue microarrays N. A. Walton1, J. D. Brenton2,3, C. Caldas2,3, M. J. Irwin1, A. Akram1, P. Maccallum3, N. Makretsov2,3, L. J. Morris2,3 1Department of Astronomy, University of Cambridge, Cambridge, UK 2Department of Oncology, University of Cambridge, Cambridge, UK; 3CRUK-Cambridge Research Institute, Cambridge, UK Introduction Antibody hybridisation and image scanning of tissue microarrays (TMAs) is a highly automated process but the subsequent manual scoring of TMAs by a trained pathologist is a major bottleneck in their analysis. We can overcome this bottleneck by applying techniques developed for astronomical imaging data, to the analysis of TMA images. We describe an initial test case application for the automated 'scoring' of Estrogen Receptor (ER). A B High score: 7 Low score: 2 Image analysis In our test case we assessed ER in TMAs that have been created using tissue samples from a large epidemiological study (UK Anglian Breast Cancer Study). Immunohistochemistry was used to assess the level of nuclear ER expression. The Allred score gives a measure of intensity (score 0-3) and proportion (score 0-5) of cells that are positively stained (giving a combined score of 0-8). But the qualitative nature of this means there are concerns of consistency of scoring across labs. The Cambridge Astronomical Survey Unit (CASU), has developed a range of high throughput image analysis algorithms to extract information from deep optical and near-infrared surveys of the cosmos. To apply these techniques to the TMA images we first separated the 3-colour channel information and reformatted the JPEG images to FITS format (Flexible Image Transport System). A master image formed from the composite of the colour channels is then used within a variant of the CASU cataloguing software to detect and parameterise the stained nuclei within each section allowing quantitative measures of their shape, size, and distribution (Figure 1). D C Results Our initial results are for a sample of 3 TMA slices – each being made up of approximately 160 tissue cores. We have generated ER scores for these utilising our method and compared against those for the same sample as determined by manual pathologist scoring and a semi-automatic technique using either Genetix Ariol software or NIH ImageJ software. • Pathgrid pipeline • Prototype application using grid infrastructural components from Astrogrid • Each processing algorithm implemented as a web service • The AstroGrid plug-in for 'Astro-Taverna' provides for interaction between various components in a workflow. • Resource discovery through appropriate metadata • Secure distributed access to results data F E A B C Conclusions We find good agreement between our method and manual pathologist scoring. Our new technique provides a range of additional information about each TMA core, is significantly faster, and gives improved interoperability with the CancerGrid trials system. The result is increased throughput and objective assessment of marker expression. • Figure 1 • The original JPEG image of a single TMA core. Blue nuclei are positively stained for ER whereas brown indicates a negative result. • The image converted to FITS format, inverted (for compatibility with astronomical analysis software), with brown now appearing as blue • Detected objects (nuclei) indicated by green ellipses Literature cited Irwin M., Lewis J. INT WFS pipeline processing, NewAR, 2001, 45, 105. Walton, N.A., Witherick, D.K., Oinn, T., Benson, K.M., 'Taverna and Workflows in the Virtual Observatory', 2008, Proc Astronomical Data Analysis Software and Systems XVII, in press Acknowledgments We thank… Figure 3. Comparison of Pathgrid image analysis results for 2 images with a high and low manual (assigned by a pathologist) Allred score for ER. Intensity is general intensity of detection, ratio is relative strength of positive staining. C and D Every object detected in A and B is indicated by a point on the graph C E and F Comparison of automated and manual scores (approximately 500 images stained for ER). The proportion statistic is calculated by taking the ratio of positively stained cells (i.e. those above the horizontal line in the previous figure) to total cells. The intensity statistic is the ratio of median value above the horizontal line to the median value for all the objects detected in an image. Figure 2 Simple processing workflow, implemented through ‘Pathgrid’s’ Astro-Taverna. The multi-step pipeline covers the login process, file transfer, image conversion, image analysis, generation of catalogues and storage