Download
1 / 34
340 likes | 484 Vues
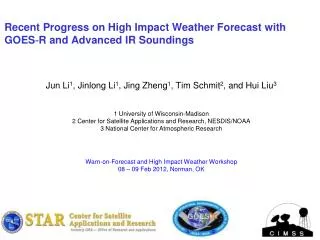
High impact weather nowcasting and short-range forecasting with advanced IR soundings . Jun Li @ , Tim Schmit & , Hui Liu # , Jinlong Li @ , Jing Zheng @ , and Elisabeth Weisz @ & Center for Satellite Applications and Research, NESDIS @CIMSS/SSEC, University of Wisconsin-Madison

E N D
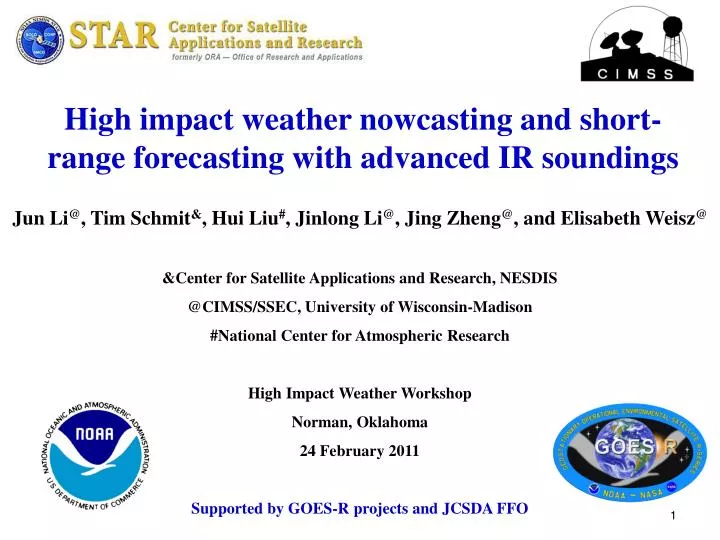
High impact weather nowcasting and short-range forecasting with advanced IR soundings Jun Li@, Tim Schmit&, HuiLiu#, Jinlong Li@, Jing Zheng@, and Elisabeth Weisz@ &Center for Satellite Applications and Research, NESDIS @CIMSS/SSEC, University of Wisconsin-Madison #National Center for Atmospheric Research High Impact Weather Workshop Norman, Oklahoma 24 February 2011 Supported by GOES-R projects and JCSDA FFO
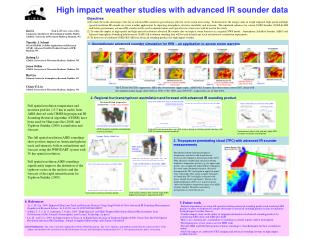
Objective • High impact weather studies with soundings • To study the combined LEO advanced IR soundings and high spatial/temporal resolution ABI profiles in pre-convection environment for mesoscale high impact weather (severe storms over CONUS, tropical cyclones, etc.) nowcasting • To study the impact of combined LEO advanced IR soundings and ABI profiles on high impact weather short-rang forecasts through data assimilation techniques • JCSDA FFO – Utilization of GOES-R data for hurricane • Collaborate with CIRA on using advanced IR soundings in operational equivalent system – HWRF/GSI for hurricane study
Methodologies/technical approaches • Direct application of LEO advanced IR soundings and high spatial/temporal resolution ABI profiles in the pre-convection environment for storm warning • Assimilating LEO advanced IR soundings and high spatial/temporal resolution ABI profiles in regional NWP for improving the instability products (LI, CAPE, KI, SI etc.) in pre-convection environment for storm warning • Assimilating LEO advanced IR soundings and high spatial/temporal resolution ABI profiles for improving short-range forecasts (hurricane track, intensity, storm precipitation, location etc.)
Progress on HIW studies • Analysis of warning information from advanced IR soundings in pre-convection environment • Using advanced IR soundings (AIRS, next IASI and in future CrIS) in hurricane forecast through WRF/DART (implemented at CIMSS) forecast/assimilation system. • 2-day assimilation followed by 4-day forecast for Hurricane Ike (2008) • 1-day assimilation followed by 2-day forecast for Typhoon Sinlaku(2008) • Using advanced IR soundings in hurricane forecast through WRF/3DVAR (implemented at CIMSS) forecast/assimilation system • 48 hour forecast for Hurricane Ike (2008) • Assimilating advanced IR soundings in regional NWP models for storm forecast through GRAPES/4DVAR (collaboration with IAP/CAS) • 24 hour precipitation forecast
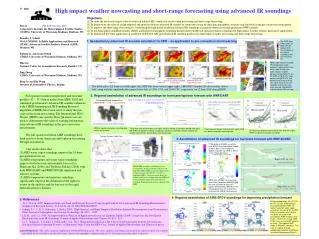
AIRS measurements overlay on GOES IR image (Hurricane Dean 2007) LEO advanced IR sounder data have limitation on coverage due to orbital gap and low temporal resolution. High temporal/spatial resolution is unique aspect of GOES-R ABI measurements Combination of GEO/LEO measurements for high impact weather applications A geostationary hyperspectral sounder could provide full hourly disk coverage rather than the partial coverage available with polar orbiting sounders.
LI = T500 – Taa • 0< LI stable • -3< LI <0 marginally unstable • -6< LI <-3 moderately unstable • -9< LI <-6 very unstable • LI <-9 extreme instability AIRS (SFOV soundings) detected atmospheric instability for Zhou Qu storm 5.5 hours pre-convection Lat=34.19; Lon=104.41 0635UTC on 07 August 2010 (storm starts 12 UTC on 07 August 2010)
(K) Zhou QuStorm Cold and dry air Warm and moist air AIRS SFOV 500 hPa temperature (K) 1840 UTC 07 August 2010 2015 UTC 07 August 2010 (g/kg) AIRS SFOV 500 hPa water vapor mixing ratio (g/kg) Southwest wind (K)
Assimilating advanced IR soundings with WRF/DART – hurricane/typhoon forecast experiments • ~10 AIRS granules over the regional WRF domain • Full spatial resolution AIRS soundings (13.5 km at nadir) are derived using CIMSS hyperspectral infrared sounding retrieval (CHISR) algorithm • Clear sky only soundings are used • Ensemble assimilation of AIRS soundings followed by ensemble forecast (36 km resolution) • CTL run: Assimilate radiosonde, satellite cloud winds, QuikSCAT winds, aircraft data, COSMIC GPS refractivity, ship, and land surface data. • AIRS run: Same as CTL run plus AIRS full spatial resolution T and Q soundings
Hurricane Ike (2008): Retrieved 500 hPatemperature 2008.09.06 – Used in assimilation) (K) CIMSS/UW Clear sky AIRS single field-of-view temperature retrievals at 500 hPa on 06 September 2008, each pixel provides vertical temperature and moisture soundings.
Hurricane Ike (2008): Retrieved 500 hPatemperature 2008.09.07 – Used in assimilation) (K) CIMSS/UW Clear sky AIRS single field-of-view temperature retrievals at 500 hPa on 07 September 2008, each pixel provides vertical temperature and moisture soundings.
Tracks of ensemble mean analysis on Hurricane IKE CTL run: Assimilate radiosonde, satellite cloud winds, aircraft data, and surface data. AIRS Analysis from 06 UTC 6 to 00UTC 8 September 2008
AIRS SLP of ensemble mean analysis on Hurricane IKE Analysis from 06 UTC 6 to 00UTC 8 September 2008
Forecast Experiments on Ike (2008) • 4-day ensemble forecasts (16 members) from the analyses on 00UTC 8 September 2008. • Track trajectory and hurricane surface central pressure are compared (every 6-hourly in the plots).
Tracks of 96h forecasts on Hurricane IKE AIRS CTRL run: Assimilate radiosonde, satellite cloud winds, aircraft data, and surface data. With AIRS No AIRS Red is observation, green is forecast Forecasts start at 00 UTC 8 September 2008
Without AIRS With AIRS Without AIRS With AIRS Track error (upper two panels) and sea level pressure from 96 hour forecasts (start at 00 UTC 8 September 2008)
Typhoon Sinlaku (2008) Fact Sinlaku Path Sinlaku rapid intensification observed
Typhoon Sinlaku(2008): Retrieved 700 hPa water vapor mixing ratio 2008.09.09 – Used in assimilation) (g/kg) (K) 700 hPa water vapor mixing ratio (g/kg) in clear skies (Sinlaku– 09 September 2008)
Typhoon Sinlaku(2008): Retrieved 700 hPa water vapor mixing ratio 2008.09.10 – Used in assimilation) (g/kg) (K) 700 hPa water vapor mixing ratio (g/kg) in clear skies (Sinlaku– 10 September 2008)
Track and Intensity Analyses for Sinlaku (2008) Rapid intensification from 9 – 10 September 2011 – water vapor soundings are important! CIMSS-T: AIRS SFOV temperature CIMSS-Q: AIRS SFOV water vapor CIMSS-TQ: AIRS SFOV temperature and water vapor
Verify forecast/analysis with geostationary IR images Observed MTSAT IR Images 10.8 μm 6.75 μm Simulated MTSAT IR Images
Assimilating advanced IR soundings with WRF/3DVAR - Hurricane forecast experiments • 2008090606_WRF/3DVAR • CTRL run: use NCEP 6-hour final operational global analysis (1.0 x 1.0 degree grids; http://dss.ucar.edu/datasets/ds083.2/), including radiosondes, satellite winds, pilot report, GPS, ship, profiler, surface observations etc., starting at 06 UTC 06 September 2008 • AIRS (Control + AIRS) run: use clear-skies from granules g066/067/068, but only assimilate 13 levels of AIRS SFOV temperature profiles between 500 and 800 hPa • Comparisons of Hurricane track for the next 48 hour forecast
AIRS 2008090606_g066, g067, g068 AIRS 700 hPa temperature (upper left), WRF 700 hPa background temperature (lower left panel), and the temperature difference between the AIRS and WRF background (lower right panel) at 06 UTC 0n 06 September 2008.
48 hour forecast starting at 06 UTC 06 September 2008 ExpCTRL vs. OBS Control run with NCEP, including radiosondes, satellite winds, pilot report, GPS, ship, profiler, surface observation, etc. ExpAIRS vs. OBS Control + assimilating 13 levels of AIRS single FOV temperature profiles between 500 and 800 hPa
48 hour forecast track bias (assimilate 500 – 800 hPaAIRS_T) 48 hour forecast SLP (assimilate 500-800 hPaAIRS_T) strongest
700 hPa Spatial Pattern: wind & wind speed t=0 t=48 hr CTRL t=0 t=48 hr AIRS
Assimilating advanced IR soundings with GRAPES/4DVAR – Storm precipitation forecast experiment • NWP and assimilation system: GRAPES/4DVAR • Assimilation time window: 18 UTC 21 July 2009, one AIRS granule is used, full spatial resolution water vapor soundings are used in the initial experiment • Forecast period: 18 UTC 21 – 00 UTC 23 July 2009 • Comparisons: 24-hour precipitation (00 UTC 22 – 00 UTC 23 July 2009), the forecasts versus ground observations
One out of 2 X 4 AIRS FOVs is selected, only 1/8 clear sky pixels are used in the assimilation. AIRS overpass time: 18:23 – 18:29 UTC 21 July 2009. CTRL run uses the NCEP analysis as initial. The regional NWP model is GRAPES_Meso2.0. AIRS overpass time: 18:23 – 18:29 UTC 21 July 2009 24 hour precipitation forecast is improved when the AIRS single field-of-view water vapor profiles are assimilated.
Summary • The advanced IR soundings provide useful warning information in pre-convection environment • AIRS SFOV temperature and water vapor soundings improve both the track and intensity forecast for Hurricane Ike (2008) and Typhoon Sinlaku (2008) with both WRF/DART and WRF/3DVAR simulation and forecast systems. • AIRS SFOV moisture soundings significantly improve the definition of the typhoon vortex in the analysis and the forecast of the rapid intensification for Typhoon Sinlaku. • AIRS SFOV water vapor soundings improve 24 hour precipitation forecast with GRAPES/4DVAR
Plans on 2011 • Study the value-added full spatial resolution advanced IR sounding data from polar-orbiting satellites for GOES-R in high impact weather nowcasting and short-range forecasting. • GOES-R ABI water vapor • GOES-R ABI water vapor + AIRS/IASI • Continue to study the unique applications of advanced IR sounder data for severe storm warning in the pre-convection environment • Extracting and application of warning information in pre-convection environment from advanced IR soundings and GOES-R profiles • Improving warning information by assimilating advanced IR soundings in regional NWP model • Study the impact of full spatial resolution advanced IR soundings on HIW forecasts through data assimilation techniques(DART, 3DVAR, 4DVAR, GSI). • Collaborate with ESRL on the better use of the advanced IR sounding data in the Rapid Refresh model. • Full spatial resolution advanced IR sounding algorithm update/improvement.
References • Li, J., H. Liu, 2009: Improved hurricane track and intensity forecast using single field-of-view advanced IR sounding measurements, Geophysical Research Letters, 36, L11813, doi:10.1029/2009GL038285. • Liu, H., and J. Li, 2010: An improvement in forecast of rapid intensification of typhoon Sinlaku (2008) using clear sky full spatial resolution advanced IR soundings, Journal of Applied Meteorology and Climate, 49, 821 – 827. • Li, J., H. Liu, and T. Schmit, 2010: Advanced infrared water vapor measurements improve hurricane forecasts. SPIE, 012337/FAE9473B/000053. (http://spie.org/x42479.xml?highlight=x2420&ArticleID=x42479) • Wang, B., J. Liu, S. Wang, W. Cheng, J. Liu, C. Liu, Q. Xiao, and Y. Kuo, 2010: An Economical Approach to Four-dimensional Variational Data Assimilation. Adv. Atmos. Sci., 27, 715 - 727.