Download
1 / 42
440 likes | 664 Vues
Measuring the returns to innovation (1). Prof. Bronwyn H. Hall Globelics Academy May 31/June 1 2004. Outline. Today Overview – measuring the returns to innovation Measuring the returns to R&D using productivity regressions Measuring the private returns to R&D using market value equations

E N D
Measuring the returns to innovation (1) Prof. Bronwyn H. Hall Globelics Academy May 31/June 1 2004
Outline Today • Overview – measuring the returns to innovation • Measuring the returns to R&D using productivity regressions • Measuring the private returns to R&D using market value equations Tomorrow • Measuring innovation using patent data • Innovation survey data Globelics Academy - Lisbon
Why is this an interesting problem? • To economists • Test models of innovation and growth, e.g., are there spillovers? • Advise policy makers • To managers • Allocation of resources for invention • Measure results of innovation • To accountants • Accurate reporting of intangible value in company accounts • To policy makers • How to increase innovative activity? • How much to spend; what policy instrument to use? How to choose the level of subsidy? • Evaluation of results of policy Globelics Academy - Lisbon
Framework • Investment in innovation (R&D, training, etc.) creates an asset which pays off in the future • At the firm (enterprise) level, asset tends to become less productive over time (it depreciates) • At the industry/country/world level, individual investments in innovation create an aggregate “knowledge” asset • Aggregate knowledge depreciates more slowly • Even when private firms no longer earn returns from an innovation, the knowledge they have created remains useful Globelics Academy - Lisbon
Overall framework • Innovation investment R at time t = Rt • Innovation asset Kt = f(Rt, Rt-1, Rt-2, …) where PDV = present discounted value δ = depreciation of innovation assets π(K) = profits or welfare given K Globelics Academy - Lisbon
Map of innovation inputs and outputs Market structure and industry; appropriability environment; Government institutions Demand pull (taste, market size) Tech. opportunity (science base) Firm size and market share, diversification, and experience R&D and other innovation investments Knowledge firm-level capital created by innovation investment Economy-wide knowledge Innovation output Patents, other IPR Innovative sales Outcomes: Productivity, Profitability, Value, and Economic Growth Diffusion process Physical capital Worker skills Globelics Academy - Lisbon
Input measures • R&D spending • within firm • alliance and joint venture participation • Purchase of new capital equipment • important for small firm innovation • Technology purchases/licensing • Marketing related to new products • Training and education of workers • Spillover variables • Based on geography or technology • CIS variables • Whether a firm is “innovative” • Sources of knowledge – suppliers, partners, consumers, internal Globelics Academy - Lisbon
Intermediate inputs/outputs • Patent counts • Raw • Weighted by citations received • Innovation/new product counts • From news journals • From surveys • CIS – shares of sales that is • New to market (radical?) • New to firm (incremental?) Globelics Academy - Lisbon
Output measures • Individual innovations • Licensing fees • Patent renewals as a function of fee schedule (Schankerman-Pakes) • Surveys (Harhoff, Scherer, Vopel) • Firm level • Profits or revenue productivity (not intertemporal) • Stock or financial market value - covers a broad range of technology & industry, but requires active stock market (Griliches, Hall, etc.) • Economy level (social returns) • Consumer willingness-to-pay (Trajtenberg) • Aggregate productivity growth (Griliches, etc.) Globelics Academy - Lisbon
Relating inputs and outputs • Production function approach – private and/or social returns • Market value approach – private returns • Patents as indicators of innovation activity • Using innovation surveys Globelics Academy - Lisbon
1. Production function framework • Cobb-Douglas production (first order log approximation to production function) • Line of business, firm, industry, or country level • Variety of estimating equations: • Conventional production function • Partial or total factor productivity function • R&D intensity formulation • Semi-reduced form (add variable factor demand equations) Globelics Academy - Lisbon
Conceptual issues • What is output? • Conventional measures exclude much of the benefit of government R&D – space, defense, environment, health • Unmeasured quality change and new goods • Revenue or output? • What is knowledge capital? • Varying lags in producing knowledge • Depreciation is endogenous at the firm level • Own capital depends on the efforts of others as well as the firm itself (spillovers) Globelics Academy - Lisbon
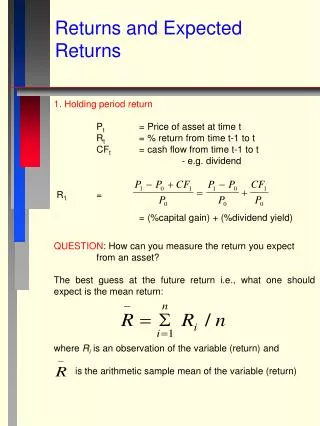
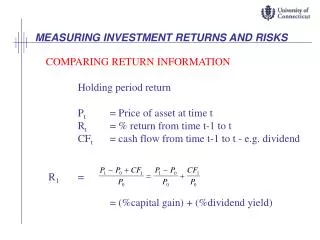
Productivity approach (1) where L = labor C = capital K = research or knowledge capital u = random shock Globelics Academy - Lisbon
Productivity approach (2) Take logarithms and model the intercept with year and firm (or industry) effects: Econometrics: The error u may possibly be correlated with the current (and future) input levels. The firm effect η may also be correlated with input levels. Globelics Academy - Lisbon
Alternative formulations Differencing to remove firm effect: R&D intensity version: Globelics Academy - Lisbon
Alternative formulations Partial or total factor productivity: Where α and β may be estimated using factor shares at the firm level (when available). This approach often combined with the R&D intensity approach. Note the change in the assumptions on u required for consistency. Globelics Academy - Lisbon
Some measurement issues • Often we have only sales, and not value added nor materials • Assume materials share constant across time for each firm • Result is that coefficients are inflated by (1-share of materials) – confirmed in practice • Double counting of R&D (Schankerman 1981) • R&D expenditure is also in labor and capital • Under simple assumptions, elasticity is downward biased by share of R&D in growth of labor/capital • Effects of choice of deflators (input and output) Globelics Academy - Lisbon
Simultaneity • Sources of endogeneity: • Inputs and output chosen simultaneously; favorable productivity experience leads to increased R&D effort in the future • Firm knows its efficiency level (fixed effect) when choosing inputs • Inputs measured with error • Solutions • Difference to remove fixed effect, exacerbates measurement error bias • Total or partial productivity moves some inputs to left hand side • Instrumental variables, in particular GMM for panel data Globelics Academy - Lisbon
French Firms 1981-1989 Source: Mairesse and Hall 1999 Globelics Academy - Lisbon
197 French firms 1980-1987 Pooled OLS estimates Source: Hall and Mairesse 1995 Globelics Academy - Lisbon
French Firms 1981-1989 Source: Hall and Mairesse 1995 Note: all estimates are inconsistent if RHS vars not strictly exogenous; within are probably least biased. Globelics Academy - Lisbon
Approximate rate of return Large R&D-doing manufacturing firms Globelics Academy - Lisbon
Output deflation at the firm level Interpreting productivity growth regressions at the firm level: versus If (2) is estimated instead of (1), we obtain an estimate of The revenue productivity of R&D is the sum of • true productivity of R&D • the effect R&D has on the prices at which goods are sold (due to quality improvements, product differentiation, and cost reduction) Globelics Academy - Lisbon
Interpretation • Revenue productivity is a determinant of private returns • True productivity (more constant quality output for a given set of inputs) is relevant for social returns • The difference represents pecuniary externalities • benefits received by downstream producers and consumers in the form of lower prices • in some cases, these can be large Globelics Academy - Lisbon
Illustration • Some U.S. deflators at the industry level are hedonic, notably those for the computer industry and now the communications equipment industry (see next slide) • Deflate firm sales by 2-digit deflators instead of one overall deflator • Result: true productivity is substantially higher than revenue productivity, because of hedonic price declines in these R&D-intensive industries Globelics Academy - Lisbon
Hedonic Price Deflator for Computers Globelics Academy - Lisbon
Estimated R&D Elasticity – U.S. Manufacturing Firms Method of estimation is GMM-system with lag 3 and 4 instruments. Sample sizes for the three subperiods are 7156, 6507, and 6457. Globelics Academy - Lisbon
Firm stock market value • Measurement of private returns to investment in innovation Globelics Academy - Lisbon
Why market value? • Returns to innovation are the profits earned in the future from investments made today • Firm value on financial markets is a forward looking measure, allows intertemporal production of innovations • Under an efficient markets assumption, equal to the expected value of the discounted cash flows that will be received in the future from the assets of the firm • Observable for a wide range of firms and countries (although not as wide as we would like) • Measuring intangible assets a present-day problem for economists and accountants • Exploring this methodology helps our understanding of how to measure innovation assets Globelics Academy - Lisbon
Theoretical framework • Measured market value = value function associated with firm’s profit-maximizing dynamic program • References • Hayashi (Econometrica 1982) – conditions under which marginal = average Q (including taxes) • Wildasin (AER 1982) – same thing for multiple capitals • Hayashi & Inoue (Econometrica 1991) – same model with capital aggregator function Globelics Academy - Lisbon
Theoretical Q model • Tobin’s original Q = ratio of the market value V of a (unique) asset to its replacement cost A • Q>1 => invest to create more of the asset • Q<1 => disinvest to reduce asset • Q=1 in equilibrium • Hayashi (1982) - the asset is a firm • derived Q from the firm’s dynamic program • gave conditions under which marginal Q (dV/dA) equal to average (V/A) • Hayashi-Inoue (1991) and Wildasin (1984) • developed the theory with more than one capital • See Hall 2004 for application here Globelics Academy - Lisbon
Practice: hedonic regression Vit(Ait,Kit) = bt [Ait + γKit] Linear approx: log Vit - log Ait = log Qit = log bt + γ Kit/Ait Non linear: log Qit = log bt + log(1+γtKit/Ait) • Qit =Vit /Aitis Tobin’s q • bt= overall market level (approximately one) • Kit/Ait = ratio of intangible innovation assets to tangible • γt= relative shadow value of K assets • (γ = 1 if depreciation correct, investment strategy optimal, and no adjustment costs). Globelics Academy - Lisbon
Typical firm’s balance sheet Globelics Academy - Lisbon
What belongs in the value eq? • Onlythe assets (resource base) of the firm • Physical capital (A) • Knowledge capital (K), including IT capital such as software • Purchased intangibles (I) • Reputational capital, brand name value (stock of advertising) • Human capital, to the extent that it is not captured in wages • Other infrastructural capital, such as the existence of a distribution network • Not such things as growth in sales or profitability unless they are used as proxies for left-out types of capitals (similarly for fixed effects?) Globelics Academy - Lisbon
Constructing innovation stocks Kt = (1-δ)Kt-1 + Rt where Kt = knowledge stock at end of period t Rt= flow of innovation investment during t δ = depreciation rate of K, usually = 15% If R grows at a constant rate g over time, then Kt ≈ Rt /(δ+g) • Low coefficient on K or R may imply δ >>0.15 Globelics Academy - Lisbon
Empirical evidence • Industry aggregates - industries with high Q have high R&D intensity • Firm-level • Functional form? • Changes over time Globelics Academy - Lisbon
LogQ = 0.58 + 0.40 log(K/A) Globelics Academy - Lisbon
Median Q and K/A for selected industries Globelics Academy - Lisbon
A Puzzle? • Compare changes 1972-1999 • Market value of R&D capital using hedonic model • Revenue productivity of R&D capital • Average R&D to sales ratio • Results • Market value declines during 1980s from 1 to around .2 • R&D productivity increases steadily from .02 to .10 • Firms investment rate jumps during 1980s from .02 to .04. • Why? Globelics Academy - Lisbon
U. S. Trends in R&D Productivity Globelics Academy - Lisbon
Some open questions • Relationship between firm-level (revenue) productivity and aggregate productivity • Puzzles • Has the productivity of R&D declined? • How do we reconcile • R&D intensity and R&D growth versions of production function? • Market value and productivity versions of rate of return computation? • Firm and industry results? • R&D Stock computation • R&D is cumulative, creates “knowledge” • Decay of useful knowledge not the same as decay of private returns from that knowledge • How to measure and account for this fact in our models? Globelics Academy - Lisbon