Download
1 / 45
450 likes | 623 Vues
Biome-BGC and Estimations of Tower Fluxes. Chequamegon Ecosystem-Atmosphere Study August 16-21, 2002. Faith Ann Heinsch 1 , John Kimball 2 , and Steve Running 1 1 Numerical Terradynamic Simulation Group 2 Flathead Lake Biological Station University of Montana. MODIS NPP Calculation.

E N D
Biome-BGC and Estimations of Tower Fluxes Chequamegon Ecosystem-Atmosphere Study August 16-21, 2002 Faith Ann Heinsch1,John Kimball2, and Steve Running1 1Numerical Terradynamic Simulation Group 2 Flathead Lake Biological Station University of Montana
NPP (Net Primary Production) • Quantifies vegetation growth • Uses: • component of NEP for terrestrial carbon source/sink analyses [global interest] • practical measure of crop/range/forest growth [local interest]
MODIS Productivity Design Limitations…. • • Based on Remotely-Sensed LAI estimate • • 1 km2 resolution (possibly 250 m2) • • Accuracy of supplemental inputs • Vegetation Classification • Weather & Radiation Data • • Lack of growth respiration in weekly productivity
MODIS Productivity Design Limitations imply that... • Can provide accurate large scale depictions of relative differences in productivity • Accuracy of estimates at smaller scale will be subject to the accuracy of the vegetation classification and weather & radiation data
Satellite Signal Related to 1. Leaf area 2. Canopy structure 3. Viewing angle Leaf Leaf Leaf Leaf Leaf Leaf Ground Remote Sensing of Vegetation Photosynthetically Active Radiation (PAR=0.45Rnet )
NDVI Leaf Area Index (LAI) Fraction of Absorbed Photosynthetically Active Radiation (FPAR)
MODIS Productivity Data Flow MODIS Instrument Canopy Structure 1 km2 Reflectance Data Vegetation Cover Algorithm Temperature & Radiation Leaf Area Index (LAI) Fraction of Radiation Absorbed (FPAR) Vegetation Type Weekly & Annual Productivity Vegetation Productivity Algorithm
Net Primary Productivity (g C/m2) Gross Photosynthesis Respiration = - NPP GPP R Vegetation Productivity
MODIS Photosynthesis The Monteith equation…. Absorbed Photosynthetically Active Radiation Radiation Use Efficiency GPP = x APAR (FPAR) (0.45Rnet )
Maximum Radiation Use Efficiency under ideal conditions for each biome Vapor Pressure Deficit Coefficient Temperature Coefficient for each biome Radiation Use Efficiency = max [mtmin ][mvpd ] The coefficients are calculated from (DAO 1° resolution) daily minimum and maximum air temperature inputs
Weekly = GPP - R m_leaf - R m_fine root Annual = (Weekly)- R m_live wood - R g max (mtmin)(mvpd)(FPAR)(0.45Rnet ) GPP = MODIS Productivity
Algorithm Implementation USE OF BIOME-BGC IN DERIVING THE MOD17 BIOME PROPERTIES LOOK-UP TABLE
BIOME LOOK-UP TABLE FOR MOD17 ALGORITHM UMD vegetation class Parameter name 1 2 3 4 5 6 7 8 9 10 11 epsilon_max 0.001008 0.001259 0.001103 0.001044 0.001116 0.000864 0.000768 0.000888 0.000774 0.000604 0.000604 tmin_max 8.31 9.09 10.44 7.94 8.50 10.24 11.39 8.61 8.80 12.02 12.02 tmin_min -8.00 -8.00 -8.00 -8.00 -8.00 -8.00 -8.00 -8.00 -8.00 -8.00 -8.00 vpd_max 4100 4100 4100 4100 4100 4100 4100 4100 4100 4100 4100 vpd_min 930 930 930 930 930 930 930 930 930 930 930 sla 22.1 17.3 30.0 26.2 21.5 33.8 39.8 12.0 28.5 45.0 45.0 q10_mr 2.0 2.0 2.0 2.0 2.0 2.0 2.0 2.0 2.0 2.0 2.0 froot_leaf_ratio 1.3 1.1 1.3 1.1 1.1 1.5 1.8 1.0 1.5 2.0 2.0 livewood_leaf_rat 0.081 0.162 0.152 0.203 0.132 0.107 0.051 0.079 0.040 0.000 0.000 leaf_mr_base 0.00653 0.00604 0.00805 0.00778 0.00677 0.00824 0.00869 0.00519 0.00714 0.00908 0.00908 froot_mr_base 0.00519 0.00519 0.00519 0.00519 0.00519 0.00519 0.00519 0.00519 0.00519 0.00519 0.00519 livewood_mr_base 0.00322 0.00397 0.00297 0.00371 0.00372 0.00212 0.00100 0.00436 0.00218 0.00000 0.00000 leaf_gr_base 0.3 0.3 0.3 0.3 0.3 0.3 0.3 0.3 0.3 0.3 0.3 froot_leaf_gr_rati 1.3 1.1 1.3 1.1 1.1 1.5 1.8 1.0 1.5 2.0 2.0 livewood_leaf_gr_r 0.16 0.20 0.15 0.19 0.19 0.11 0.05 0.22 0.11 0.0 0.0 deadwood_leaf_gr_r 1.6 1.1 1.5 1.6 1.8 1.0 0.5 0.0 0.0 0.0 0.0
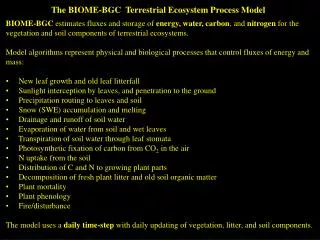
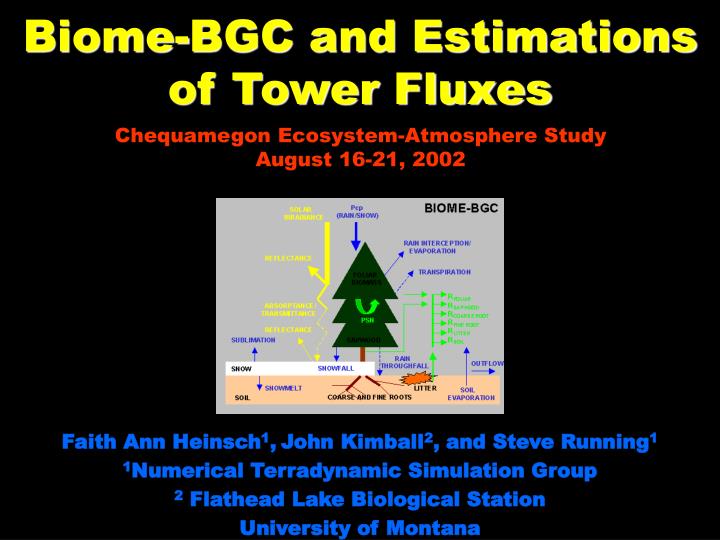
The BIOME-BGC Terrestrial Ecosystem Process Model • BIOME-BGC estimates fluxes and storage of energy, water, carbon, and nitrogen for the vegetation and soil components of terrestrial ecosystems. • Model algorithms represent physical and biological processes that control fluxes of energy and mass: • New leaf growth and old leaf litterfall • Sunlight interception by leaves, and penetration to the ground • Precipitation routing to leaves and soil • Snow (SWE) accumulation and melting • Drainage and runoff of soil water • Evaporation of water from soil and wet leaves • Transpiration of soil water through leaf stomata • Photosynthetic fixation of carbon from CO2 in the air • N uptake from the soil • Distribution of C and N to growing plant parts • Decomposition of fresh plant litter and old soil organic matter • Plant mortality • Plant phenology • Fire/disturbance • The model uses a daily time-step with daily updating of vegetation, litter, and soil components.
Major Features: • Daily time step (day/night partitioning based on daily information); • Single, uniform soil layer hydrology (bucket model); • 1 uniform snow layer of SWE (no canopy snow interception/losses); • 1 canopy layer (sunlit/shaded leaf partitioning); • Dynamic phenology and C/N allocation (e.g. LAI, biomass, soil and litter) • Disturbance (fire) and mortality functions • Variable litter and soil C decomposition rates (3 litter and 4 soil C pools) BIOME-BGC
Meteorological Parameters Required by Biome-BGC • Daily maximum temperature (°C) • Daily minimum temperature (°C) • Daylight average temperature (°C) • Daily total precipitation (cm) • Daylight average partial pressure of water vapor (Pa) • Daylight average shortwave radiant flux density (W/m2) • Daylength (s)
What if Some Met Data is Missing? • Use a nearby weather station • Use MT-CLIM to estimate radiation and humidity measurements from Tmax, Tmin • designed to handle complex terrain • uses a base station to calculate “site” data • Use DAYMET (conterminous U.S. only) • uses several met stations surrounding site • data available from 1980-1997 • takes into account complex terrain
BIOME-BGC Eco-physiological Parameters Biome-BGC uses a list of 43parameters to differentiate biomes. These parameters define the general eco-physiological characteristics of the dominant vegetation type and must be specified prior to each model simulation. These parameters can be measured in the field, obtained from the literature or derived from other measurements. Default Biome types with defined parameters • Deciduous Broadleaf Forest (temperate) • Deciduous Needleleaf forest (larch) • Evergreen Broadleaf Forest (subtropical/tropical) • Evergreen Needleleaf Forest • Evergreen Shrubland • C3 Grassland • C4 Grassland
Biome-BGC Default Eco-physiological Parameters: Evergreen Needleleaf Forest
BIOME-BGC Environmental Controls on Canopy Conductance (Walker Branch Site) M_total,sun,shade = (MPPFD,sun,shade * MTmin * MVPD * MPSI) where multipliers range from 0 (full Gs reduction) to 1 (no effect) Gs, sun,shade = Gs,max * M_total, sun,shade
MET_INPUT (keyword) start of meteorology file control block BIOME-BGC Example Initialization File metdata/TDE.mtc41 meteorology input filename 4 (int) header lines in met file RESTART (keyword) start of restart control block 1 (flag) 1 = read r estart file 0 = don't read restart file 0 (flag) 1 = write restart file 0 = don't write restart file 0 (flag) 1 = use restart metyear 0 = reset metyear restart/TDE_n.endpoint input restart filename restart/TDE. endpoint output restart filename TIME_DEFINE (keyword - do not remove) 8 (int) number of meteorological data years 8 (int) number of simulation years 1993 (int) first simulation year 0 (flag) 1 = spinup simulation 0 = normal simulation 6000 (int) maximum number of spinup years (if spinup simulation) CLIM_CHANGE (keyword - do not remove) 0.0 (deg C) offset for Tmax 0.0 (deg C) off set for Tmin 1.0 (DIM) multiplier for Prcp 1.0 (DIM) multiplier for VPD 1.0 (DIM) multiplier for shortwave radiation CO2_CONTROL (keyword - do not remove) 1 (flag) 0=constant 1=vary with fil e 2=constant, file for Ndep 356.0 (ppm) constant atmospheric CO2 concentration TDE_co2.txt (file) annual variable CO2 filename SITE (keyword) start of site physical constants block 0.765 (m) effective soil dept h (corrected for rock fraction) 28.0 (%) sand percentage by volume in rock - free soil 64.0 (%) silt percentage by volume in rock - free soil 8.0 (%) clay percentage by volume in rock - free soil 290.0 (m) site elevation 35.95 (degrees) site latitude ( - for S.Hem.) 0.2 (DIM) site shortwave albedo 0.0005 (kgN/m2/yr) wet+dry atmospheric deposition of N 0.0004 (kgN/m2/yr) symbiotic+asymbiotic fixation of N
RAMP _NDEP (keyword - do not remove) 0 (flag) do a ramped N - deposition run? 0=no, 1=yes BIOME-BGC Example Initialization File (cont.) 2099 (int) reference year for industrial N deposition 0.0001 (kgN/m2/yr) industrial N deposition value EPC_FILE (keyword - do no t remove) dbf.epc (file) TDE DBF ecophysiological constants W_STATE (keyword) start of water state variable initialization block 0.0 (kg/m2) water stored in snowpack 0.5 (DIM) initial soil water as a proportion of sa turation C_STATE (keyword) start of carbon state variable initialization block 0.001 (kgC/m2) first - year maximum leaf carbon 0.0 (kgC/m2) first - year maximum stem carbon 0.0 (kgC/m2) coarse woody debris carbon 0. 0 (kgC/m2) litter carbon, labile pool 0.0 (kgC/m2) litter carbon, unshielded cellulose pool 0.0 (kgC/m2) litter carbon, shielded cellulose pool 0.0 (kgC/m2) litter carbon, lignin pool 0.0 (kgC/m2) soil carbon, fast microbial recycling pool 0.0 (kgC/m2) soil carbon, medium microbial recycling pool 0.0 (kgC/m2) soil carbon, slow microbial recycling pool 0.0 (kgC/m2) soil carbon, recalcitrant SOM (slowest) N_STA TE (keyword) start of nitrogen state variable initialization block 0.0 (kgN/m2) litter nitrogen, labile pool 0.0 (kgN/m2) soil nitrogen, mineral pool OUTPUT_CONTROL (keyword - do not remove) outputs/TDE_out (text) pr efix for output files 1 (flag) 1 = write daily output 0 = no daily output 0 (flag) 1 = monthly avg of daily variables 0 = no monthly avg 0 (flag) 1 = annual avg of daily variables 0 = no annual avg 1 (flag) 1 = write annual output 0 = no annual output 1 (flag) for on - screen progress indicator DAILY_OUTPUT (keyword) 3 (int) number of daily variables to output 516 0 epv.vwc (%) 43 1 wf.soilw_trans (kg m^ - 2) 38 2 wf.canopyw_evap (kg m^ - 2) ANNUAL_OUTPUT (keyword) 2 (int) number of annual output variables 545 0 annual maximum projected LAI 636 1 vegetation C END_INIT (keyword) indicates the end of the initialization file
(MPa) (%) Soil Class Silt loam Silt Loam β-value -4.625 -3.84 -5.275 VWC_sat 0.48 0.48 0.41 PSI_sat -0.0073 -0.0078 -0.0013 BIOME-BGC 1Soil Water – Soil Water Potential Curves 1after Cosby et al., 1984
BIOME-BGC Simulated Daily Carbon and Water Exchange (1Barrow Tussock / Wet Sedge Tundra Site, 2000) Daily 1Meteorology Daily C Budget 1 Daily meteorological data obtained from Barrow W Post Station, 71.28N 156.76W
BIOME-BGC Simulated Cumulative Net Carbon Exchange (1Barrow Tussock / Wet Sedge Tundra Site) C sink (+) C source (-) 1 Daily meteorological data obtained from Barrow W Post Station, 71.28N 156.76W
C source (+) Alaska Study Region C sink (+) Site Name Latitude Kenai AK 60.18N Bonanza Creek AK 64.7N Coldfoot AK 67.15N Atigun AK 68.02N C source (+) C sink (+) Biome-BGC runs for 4 areas in Alaska
Biome-BGC Estimates of NPP Park Falls, WI
Biome-BGC Estimates of GPP Park Falls, WI
Verification of BIOME-BGC Daily and Seasonal Dynamics: Comparisons with Tower Eddy-flux Measurements Mature Aspen Stand (SSA-OA BERMS site) Mature Black Spruce Stand (NSA-OBS Ameriflux site) ET ET NEP NEP Kimball et al., 1997a,b