Download
1 / 1
10 likes | 134 Vues
Eddy-Induced Cross-Slope Exchange in the Northwestern Gulf of Alaska S.R. Okkonen 1 , T.J. Weingartner 1 , S.L. Danielson 1 , G.M. Schmidt 2 , and D.L. Musgrave 1 1 Institute of Marine Science, University of Alaska Fairbanks, Fairbanks, Alaska 99775

E N D
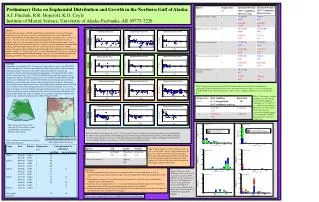
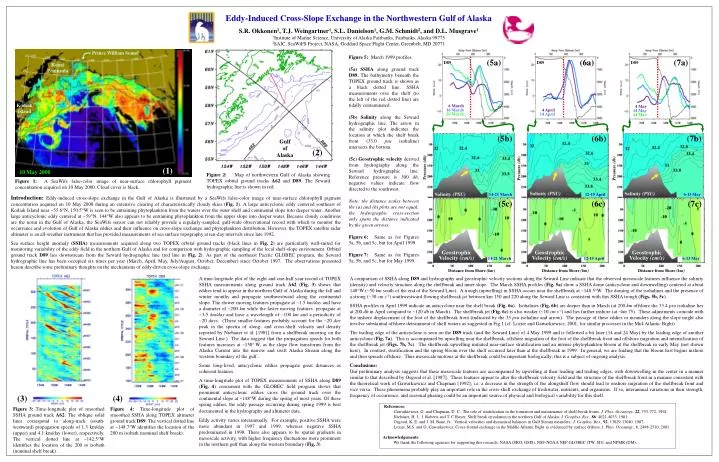
Eddy-Induced Cross-Slope Exchange in the Northwestern Gulf of Alaska S.R. Okkonen1, T.J. Weingartner1, S.L. Danielson1, G.M. Schmidt2, and D.L. Musgrave1 1Institute of Marine Science, University of Alaska Fairbanks, Fairbanks, Alaska 99775 2SAIC, SeaWiFS Project, NASA, Goddard Space Flight Center, Greenbelt, MD 20771 Prince William Sound Figure 5: March 1999 profiles. (5a)SSHA along ground track D89. The bathymetry beneath the TOPEX ground track is shown as a black dotted line. SSHA measurements over the shelf (to the left of the red dotted line) are tidally contaminated. (5b)Salinity along the Seward hydrographic line. The arrow in the salinity plot indicates the location at which the shelf break front (33.0 psu isohaline) intersects the bottom. (5c)Geostrophic velocity derived from hydrography along the Seward hydrographic line. Reference pressure is 300 db, negative values indicate flow directed to the southwest. Note: the distance scales between the (a) and (b) plots are not equal; the hydrographic cross-section only spans the distance indicated by the green arrows. Figure 6: Same as for Figures 5a, 5b, and 5c, but for April 1999. Figure 7: Same as for Figures 5a, 5b, and 5c, but for May 1999. (5a) (6a) (7a) D89 D89 D89 Kenai Peninsula 6 March 16 March 26 March Kodiak Island 4 April 14 April 4 May 14 May 24 May D89 D89 D89 (5b) (6b) (7b) Gulf of Alaska (2) (1) Pressure (db) Pressure (db) 10 May 2000 Figure 2: Map of northwestern Gulf of Alaska showing TOPEX orbital ground tracks A62 and D89. The Seward hydrographic line is shown in red. Figure 1: A SeaWifs false-color image of near-surface chlorophyll pigment concentration acquired on 10 May 2000. Cloud cover is black. 14-21 March 12-19 April 6-13 May Introduction: Eddy-induced cross-slope exchange in the Gulf of Alaska is illustrated by a SeaWifs false-color image of near-surface chlorophyll pigment concentration acquired on 10 May 2000 during an extensive clearing of characteristically cloudy skies (Fig. 1). A large anticyclonic eddy centered southeast of Kodiak Island near ~55.6N, 150.5W is seen to be entraining phytoplankton from the waters over the outer shelf and continental slope into deeper water. Another large anticyclonic eddy centered at ~59N, 144W also appears to be entraining phytoplankton from the upper slope into deeper water. Because cloudy conditions are the norm in the Gulf of Alaska, the SeaWifs sensor can not reliably provide a regularly-sampled, gulf-wide observational record with which to monitor the occurrence and evolution of Gulf of Alaska eddies and their influence on cross-slope exchange and phytoplankton distribution. However, the TOPEX satellite radar altimeter is an all-weather instrument that has provided measurements of sea surface topography at ten-day intervals since late 1992. Sea surface height anomaly (SSHA) measurements acquired along two TOPEX orbital ground tracks (black lines in Fig. 2) are particularly well-suited for monitoring variability of the eddy field in the northern Gulf of Alaska and for comparison with hydrographic sampling of the local shelf-slope environment. Orbital ground track D89 lies downstream from the Seward hydrographic line (redline in Fig. 2). As part of the northeast Pacific GLOBEC program, the Seward hydrographic line has been occupied six times per year (March, April, May, July/August, October, December) since October 1997. The observations presented herein describe some preliminary thoughts on the mechanisms of eddy-driven cross-slope exchange. (5c) (6c) (7c) Geostrophic Velocity (cm/s) Geostrophic Velocity (cm/s) Geostrophic Velocity (cm/s) 14-21 March 12-19 April 6-13 May Distance from Shore (km) Distance from Shore (km) Distance from Shore (km) A time-longitude plot of the eight and one-half year record of TOPEX SSHA measurements along ground track A62 (Fig. 3) shows that eddies tend to appear in the northern Gulf of Alaska during the fall and winter months and propagate southwestward along the continental slope. The slower moving features propagate at ~1.5 km/day and have a diameter of ~200 km while the faster moving features propagate at ~3-5 km/day and have a wavelength of ~100 km and a periodicity of ~20 days. (These smaller features probably account for the ~20 day peak in the spectra of along- and cross-shelf velocity and density reported by Niebauer et al. [1981] from a shelfbreak mooring on the Seward Line.) The data suggest that the propagation speeds for both features increases at ~150W, as the slope flow transforms from the Alaska Current into the narrow and swift Alaska Stream along the western boundary of the gulf. Some long-lived, anticyclonic eddies propagate great distances as coherent features. A time-longitude plot of TOPEX measurements of SSHA along D89 (Fig. 4) concurrent with the GLOBEC field program shows that prominent anticyclonic eddies cross the ground track over the continental slope at ~148W during the spring of most years. Of these spring eddies, the eddy passage occurring during spring 1999 is best documented in the hydrography and altimeter data. Eddy activity varies interannually. For example, positive SSHA were more abundant in 1997 and 1999, whereas negative SSHA predominated in 1998. There also appears to be spatial gradients in mesoscale activity, with higher frequency fluctuations more prominent in the northern gulf than along the western boundary (Fig. 3). A comparison of SSHA along D89 and hydrography and geostrophic velocity sections along the Seward Line indicate that the observed mesoscale features influence the salinity (density) and velocity structure along the shelfbreak and inner slope. The March SSHA profiles (Fig. 5a) show a SSHA dome (anticyclone and downwelling) centered at about 148W (~50 km south of the end of the Seward Line). A trough (upwelling) in SSHA occurs near the shelfbreak at ~148.5W. The doming of the isohalines and the presence of a strong (~30 cm s-1) southwestward flowing shelfbreak jet between km 150 and 220 along the Seward Line is consistent with this SSHA trough (Figs. 5b, 5c). SSHA profiles in April 1999 indicate an anticyclone near the shelf break (Fig. 6a). Isohalines (Fig. 6b) are deeper than in March (at 200 km offshore the 33.4 psu isohaline lies at 200 db in April compared to ~120 db in March). The shelfbreak jet (Fig. 6c) is also weaker (~10 cm s-1) and lies further inshore (at ~km 75). These adjustments coincide with the inshore displacement of the foot of the shelfbreak front (indicated by the 33 psu isohaline and arrow). The passage of these eddies or meanders along the slope might also involve substantial offshore detrainment of shelf waters as suggested in Fig.1 (cf. Lozier and Gawarkiewicz, 2001, for similar processes in the Mid-Atlantic Bight) The trailing edge of the anticyclone is seen on the D89 track (and the Seward Line) of 4 May 1999 and is followed a bit later (14 and 24 May) by the leading edge of another anticyclone (Fig. 7a). This is accompanied by upwelling near the shelfbreak, offshore migration of the foot of the shelfbreak front and offshore migration and intensification of the shelfbreak jet (Figs. 7b, 7c). The shelfbreak upwelling initiated near-surface stratification and an intense phytoplankton bloom at the shelfbreak in early May (not shown here). In contrast, stratification and the spring bloom over the shelf occurred later than at the shelfbreak in 1999. In general, we are finding that the bloom first begins inshore and then spreads offshore. Thus mesoscale motions at the shelfbreak could be important biologically; this is a subject of ongoing analysis. Conclusions: Our preliminary analysis suggests that these mesoscale features are accompanied by upwelling at their leading and trailing edges, with downwelling in the center in a manner similar to that described by Osgood et al. [1987]. These features appear to alter the shelfbreak velocity field and the structure of the shelfbreak front in a manner consistent with the theoretical work of Gawarkiewicz and Chapman [1992]; i.e. a decrease in the strength of the alongshelf flow should lead to onshore migration of the shelfbreak front and vice versa. These phenomena probably play an important role in the cross-shelf exchange of freshwater, nutrients, and organisms. If so, interannual variations in their strength, frequency of occurrence, and seasonal phasing could be an important source of physical and biological variability for this shelf. (3) (4) References: Gawarkiewicz, G. and Chapman, D. C., The role of stratification in the formation and maintenance of shelf-break fronts, J. Phys. Oceanogr.,22, 753-772, 1992. Niebauer, H. J., J. Roberts and T. C Royer, Shelf break circulation in the northern Gulf of Alaska, J. Geophys. Res., 86: 4021-4033, 1981. Osgood, K. E. and J. M. Bane, Jr., Vertical velocities and dynamical balances in Gulf Stream meanders, J. Geophys. Res., 92: 13029-13040, 1987. Lozier, M.S. and G. Gawarkiewicz, Cross-frontal exchange in the Middle Atlantic Bight as evidenced by surface drifters, J. Phys. Oceanogr., 8, 2498-2510, 2001. Acknowledgements: We thank the following agencies for supporting this research: NASA (SRO, GMS), NSF-NOAA NEP GLOBEC (TW, SD), and NPMR (DM). Figure 3: Time-longitude plot of smoothed SSHA ground track A62. The oblique solid lines correspond to along-track (south-westward) propagation speeds of 1.3 km/day (upper) and 4.1 km/day (lower), respectively. The vertical dotted line at ~142.5W identifies the location of the 200 m isobath (nominal shelf break). Figure 4: Time-longitude plot of smoothed SSHA along TOPEX altimeter ground track D89. The vertical dotted line at ~148.7W identifies the location of the 200 m isobath (nominal shelf break).


![Freshwater Variability on the Gulf of Alaska Shelf [ OS42A-01 ]](https://cdn2.slideserve.com/3972677/slide1-dt.jpg)