Download
1 / 28
390 likes | 1.08k Vues
Ventricular Pressure-Volume Loops. Steve Wood, PhD scwood@salud.unm.edu. I I. The Ventricle as a Pump: Cardiac Output = HR x SV. Cardiac Output. Heart Rate. Stroke Volume. +. +. -. +. -. Preload. Afterload. Inotropy. +. +. +. PNS. SNS.

E N D
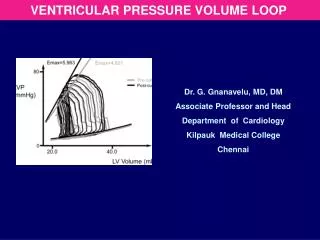
Ventricular Pressure-Volume Loops Steve Wood, PhD scwood@salud.unm.edu
II. The Ventricle as a Pump: Cardiac Output = HR x SV Cardiac Output Heart Rate Stroke Volume + + - + - Preload Afterload Inotropy + + + PNS SNS
III. The Ventricle as a Pump: Frank-Starling Curves • Single Starling Curve • Normal values are LVEDP 8 mmHg and SV of 70 ml/beat. • Cytosolic Ca++ constant. Inotropy (contractility) is constant. • The increased force of contraction at greater preload is due to: (1) favorable overlap of thin and thick filaments; and (2) increased affinity of Ca++ for Troponin C. Preload
afterload inotropy Frank-Starling Curves Inotropy afterload Changes in afterload and contractility (inotropy ) shift the Frank-Starling curve up or down (at any given preload) PV loops explain this – slide 18 Preload
A drug which caused vasoconstriction of systemic veins (alpha agonist) would shift point 1 to point ___. A B C D
Starling Curves in Heart Failure Increased contractility Normal Stroke Volume (or cardiac output) a Heart failure c b Hypotension Pulmonary congestion Left Ventricular end-diastolic pressure (or end-diastolic volume)
IV. Pressure-Volume Relationships in the Ventricles This isovolumic curve is also called Po (pressure at zero ejection), or the end-systolic pressure volume relationship (ESPVR). This "resting" curve represents pressures during diastolic filling of the ventricle, and reflects passive properties of the ventricular wall that resist stretch; i.e., the compliance of the ventricle and factors that impair Ca++ reuptake into SR (e.g., hypoxia) (Lusitropy)
V. PRESSURE-VOLUME LOOPS ESPVR c 3 LV Pressure, mm Hg Afterload 100 2 3 2 4 LV Pressure, mm Hg d SV 1 b EDPVR EDV LV Volume, ml 1 4 ESV a 0 0 50 120 200 LV Volume, ml Preload
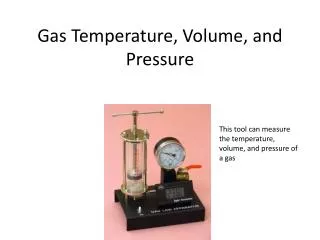
Work of the Heart Cardiac Work = Stroke work x HR Work = force x distance = force x cm P = force/unit area = force/cm2 Volume = cm3 P x V = force/cm2 x cm3 = force x cm
Oxygen Demand of the Heart HR x SBP VO2
Stroke Work Curve inotropy Inotropy When stroke work is plotted against preload ONLY changes in inotropy will shift curve. Stroke Work (P x V)
VI. Effects of Preload, Afterload, Inotropy and Lusitropy on Ventricular Pressure-Volume Loops A. Effect of Preload on Stroke Volume Effect of Increased Preload • At constant afterload and inotropy • SV increases and ESV remains constant • EF increases • Dashed lines are systolic and diastolic pressures
Effect of Decreased Preload • At constant afterload and inotropy • SV decreases and ESV remains constant • EF decreases slightly Effects of changing preload = Starling’s Law
B. Effect of Afterload on Stroke Volume Effect of Increased Afterload • At constant preload and inotropy • SV decreases and ESV increases • EF decreases • No change in contractility (aortic closure occurs on the same line) • This is an acute effect of sudden increase in afterload; in subsequent beat increased EDV will increase SV
Effect of Decreased Afterload • At constant preload and inotropy • SV increases and ESV decreases • EF increases • No change in contractility (aortic closure occurs on the same line)
C. Effect of Contractility on Stroke Volume Effect of Increased Contractility (+ Inotropy) • At constant preload and afterload • SV increases and ESV decreases • EF increases
Effect of Decreased Contractility (- Inotropy) • At constant preload and afterload • SV decreases and ESV increases • EF decreases • Over time, EDV increases causing increased LV and LA pressure – next slide
D. Systolic and Diastolic Heart Failure • Systolic Failure • EDV increases with loss of inotropy because increased ESV is added to normal venous return. • Increased EDV causes increased LV and LA pressure. • EF decreased
Compliance = V/P • Diastolic Failure • Reduction in ventricular compliance • Mechanisms: Hypertrophy; Reduced Lusitropy • LV Increased LA and pulmonary venous pressure pulmonary congestion • RV Increased RA pressure and systemic venous pressure peripheral edema • EF may not change
Combined Systolic & Diastolic Failure • Decreased SV and EF • Increased end diastolic pressure • Compensatory volume expansion further increases end diastolic pressure
VII. Practice Questions http://www.unmphysiology.org/boardreview/cardioquestions.html