Download
1 / 42
420 likes | 423 Vues
Explore the community risk factors in St. Joseph County, Indiana, including unemployment, poverty, lack of education, and more. Find resources and statistics to aid prevention efforts.

E N D
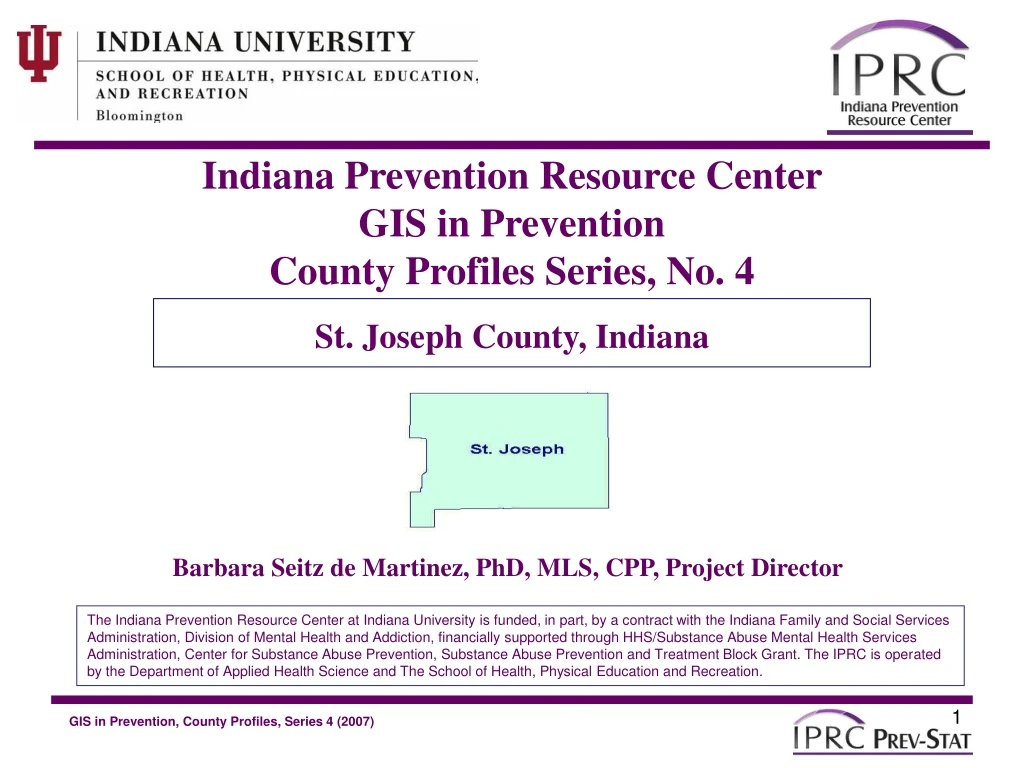
Indiana Prevention Resource Center GIS in Prevention County Profiles Series, No. 4 St. Joseph County, Indiana Barbara Seitz de Martinez, PhD, MLS, CPP, Project Director The Indiana Prevention Resource Center at Indiana University is funded, in part, by a contract with the Indiana Family and Social Services Administration, Division of Mental Health and Addiction, financially supported through HHS/Substance Abuse Mental Health Services Administration, Center for Substance Abuse Prevention, Substance Abuse Prevention and Treatment Block Grant. The IPRC is operated by the Department of Applied Health Science and The School of Health, Physical Education and Recreation.
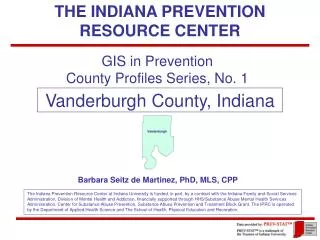
St. Joseph County Map The maps and tables in this publication were prepared using PCensus for MapInfo and MapInfo Professional.
5.1 Population Table 1a below shows total population, persons per square mile, total number of households, total land and water areas. Table 1b presents population under 24 by age. Both tables present comparisons of the county to the state and nation. Table 5.1a: Totals: Population, Households, and Geographic Characteristics (AGS, 2005 est., 2006). Table 5.1b Population by Age Source: (AGS, 2005 est., 2006)
6.16 - 6.26 Archival Risk Factors • 6.16 Unemployment • 6.17 Free Lunch/Textbooks • 6.18 Food Stamp Recipients • 6.19 TANF • 6.20 Adults w/o HS Diploma • 6.21 Single Parent Family Households • Poverty: Introduction • 6.22 Total Poverty and by Age • 6.23 Families with Own Children in Poverty • 6.24 Poverty by Race • 6.25 Single Parent Families in Poverty • 6.26 Lack of Health Insurance Community Risk Factors: Extreme Economic & Social Deprivation
6.16 Unemployment Rates Extreme deprivation, either due lack of sufficient funds for basic necessities or due to lack of sufficient social support (e.g., parenting, mentoring and role modeling) has known detrimental implications for child development and creates a high risk environment for the community. This section will explore data related to various forms of extreme deprivation in the county. The archival indicators included by CSAP for this risk factor include unemployment, free and reduced school lunch, Aid to Families with Dependent Children, Food Stamp recipients, adults without a high school diploma, and single parent households. To these variables, PREV-STAT adds total poverty statistics, child poverty by age group, and single-parent families living in poverty, and lack of health insurance coverage. Unemployment rates from the U.S. Bureau of Labor Statistics.
6.17 Free/Reduced Lunch/Textbooks The following table shows the percent of students in grades K-12 who received free lunch and textbooks, according to the Department of Education, and also the change over the past 2 years, for this county and for the state.
6.18 Food Stamp Recipients CSAP calculates this as the average number of persons who receive food stamps each month, stated as the rate per 1,000 persons in the total population. This statistic for Indiana comes from Indiana Family and Social Services Administration, Family Resources Bureau. The rate calculation comes from the Indiana Prevention Resource Center. The following table shows the rate for this county with comparisons for the state and nation.
6.19 Temporary Aid to Needy Families (TANF) CSAP calculates this indicator as the rate of persons of all ages who participate in the Aid to Families with Dependent Children (TANF in Indiana), stating the rate as the number per 1,000 persons. This table shows the average monthly average statistics for families and for recipients from the county and for Indiana as reported by the Indiana Family and Social Services Administration, Division of Family and Children. PREV-STAT has calculated the rate of TANF recipients per month per 1000 residents of the county.
6.20 Adults w/out a High School Diploma Lack of education places a person at extreme disadvantage in many areas of life, including health and income potential. CSAP calculates this risk factor as the percent of persons aged 25 and older who have reached 9th-12th grades but without obtaining a high school diploma. The following table presents 3 statistics for persons over 25 in the county: the percent who have not completed 9th grade; the percent who attended high school but did not graduate; and the percent whose educational attainment is less than a high school diploma (the sum of the first 2 statistics), compared with the state and the nation. This information points to need and also is important to prevention planning for marketing and for activities involving parents and other adults.
Map: Education Less Than 9th Grade Indiana Prevention Resource Center AGS, Core Demographics, 2005 est., 2006
Map: Education Less Than 9th Grade Indiana Prevention Resource Center AGS, Core Demographics, 2005 est., 2006
Map: Education Less Than 9th Grade AGS, Core Demographics, 2005 est., 2006 Indiana Prevention Resource Center
Map: Education: Less Than HS Diploma Indiana Prevention Resource Center AGS, Core Demographics, 2005 est., 2006
Map: Education: Less Than HS Diploma Indiana Prevention Resource Center AGS, Core Demographics, 2005 est., 2006
Map: Education: Less Than HS Diploma AGS, Core Demographics, 2005 est., 2006 Indiana Prevention Resource Center
6.21 Single Parent Family Households CSAP calculates this risk factor as the percent of family households with a spouse absent. The following table reports the percent of households with children where one parent is absent. In addition to the above risk factors listed by CSAP, PREV-STAT includes additional basic demographic statistics on total poverty, child poverty and poverty by age group, single parent families living in poverty, lack of health insurance, and households with no vehicle.
Map:Single Parent Families Indiana Prevention Resource Center AGS, Core Demographics, 2005 est., 2006
Map:Single Parent Families (contour) Indiana Prevention Resource Center AGS, Core Demographics, 2005 est., 2006
Map:Single Parent Families (prism) AGS, Core Demographics, 2005 est., 2006 Indiana Prevention Resource Center
Map:Single Moms with Children under 18 Indiana Prevention Resource Center AGS, Core Demographics, 2005 est., 2006
Map:Single Moms (contour) Indiana Prevention Resource Center AGS, Core Demographics, 2005 est., 2006
Map: Single Moms (prism) AGS, Core Demographics, 2005 est., 2006 Indiana Prevention Resource Center
6. 22 Community Risk Factor -- Poverty Poverty can be calculated based on the total population or subsets of the population. It can be expressed as a count of persons or as a percent of persons. The poverty statistics presented in this report come from the U.S. Census Bureau and from Claritas Core Demographics. Looking at the total population of persons living in a place, the poverty rate can be expressed as the number or count of persons living in poverty or as the percent of the total population in poverty. For example, in Indiana, as of the 2000 census, there were 559,484 persons living in poverty or 9% percent of the total population. This means that 9 of every 100 persons living in Indiana lived in poverty. By age, 2 of every 100 Indiana children ages 6-17 in the year 2000 lived in poverty, hence 2%. Looking at the population of persons who lived in poverty (that 9% of the total population), it can be very useful to know their ages. If we consider all persons living in poverty in Indiana as a group, we learned from the 2000 Census that of that group 11% were between the ages of 0 and 4 years, 2% were 5 years old, 11% were 6-11, and 9% were 12-17 years old. This description of poverty risk factors will report on total poverty and poverty by age group, on poverty and child poverty as percent of all persons living in poverty, poverty by race, and on single parent families in poverty.
Poverty Thresholds, 2005 Source: http://www.census.gov/hhes/www/poverty/threshld/thresh05.html, accessed 5/1/2007
6.22a Total Poverty and Poverty by Age The following table shows an overview of total poverty and poverty by age of the total population of the county with comparisons to the state of Indiana and the nation.
6.22b Total Poverty and Poverty by Age The following table shows child poverty for children ages 0-17 as number (of children in poverty) and percent (of children in poverty) for this county.
6.22c Total Poverty and Poverty by Age The following table shows child poverty for children ages 5-17 as number (of children in poverty) and percent (of children in poverty) for this county.
6.23 Families w/ Own Children in Poverty The following table of 2004 estimates presents various statistics concerning families with own children that live in poverty: percent of families with own children that live in poverty, percent of married couple families, percent of single fathers, percent of single mothers, and percent of single parents for this county and for the state.
6.23 Families w/ Own Children in Poverty The following table presents various statistics concerning families with own children that live in poverty: percent of families with own children that live in poverty, percent of married couple families, percent of single fathers, percent of single mothers, and percent of single parents for this county and for the state.
Map: Families with Children in Poverty No. of Families w/ Children under 18 as Percent of All Families with Children under 18 Indiana Prevention Resource Center Claritas™, Core Demographics, 2005 est., 2006
6.24 Poverty by Race In the effort to understand the dynamics a community, its needs and how best to design and carry-out prevention programs to meet those needs, it is helpful to analyze data by many different variables. Poverty is an example of how this principle applies. Rates of poverty differ not only between age groups but also in conjunction with other variables, such as race/ethnicity and marital and parenting status. PREV-STAT can help the prevention professional look at such combinations of variables to identify an area of need or to better understand a target audience. First we report on poverty and race, secondly on marital status, parent status and poverty (single parents in poverty).
6.24 Poverty by Race in the U.S. Source: http://www.census.gov/hhes/www/poverty/poverty05/table5.html, accessed 5/1/2007
6.25Single Parent Families w/ Children in Poverty The following table shows the various types of households with children under 18 living in poverty with comparisons to the state and the nation.
6.25Single Parent Families w/ Children in Poverty The following table shows the various types of households with children under 18 living in poverty with comparisons to the state and the nation.
Map: Single Moms w/ Children under 18 in Poverty Indiana Prevention Resource Center Claritas™, Core Demographics, 2005 est., 2006
6.26 Lack of Health Insurance We consider lack of health insurance to be a form of extreme deprivation. Research has shown that two of the strongest indicators of self-reported health status and routine preventative care are having a consistent source of medical care and having health insurance. Where either is absent there is a higher risk of health problems and particularly of not receiving preventative care. Lack of health insurance is often associated with lack of employment or underemployment, poverty, being in transition, and/or undocumented immigrant status. The following table shows rates of health insurance coverage for this county, compared with Indiana and the nation.
6.26b Source of Health Insurance The source of health insurance provides insight into the circumstances of the individual. A county where more people are receiving Medicaid or Medicare are more subject to the impact of legislation that would affect those programs. A county where more people are receiving insurance from a union may be impacted by factory closures and outsourcing of jobs. Insurance from jobs is a sign of employment status. The following table shows the sources of health insurance for this county compared with Indiana and the nation.
Map: No Health Insurance Indiana Prevention Resource Center AGS, Consumer Behavior, Insurance 2005 est., 2006
Map: Health Insurance from Union or Work Indiana Prevention Resource Center AGS, Consumer Behavior, Insurance 2005 est., 2006
Additional Background on Health Insurance Overview The number of people with health insurance coverage rose from 242.4 million in 2002 to 243.3 million in 2003. Nonetheless, the percentage with coverage dropped from 84.8 percent to 84.4 percent, mirroring a drop in the percentage of people covered by employment-based health insurance (61.3 percent in 2002 to 60.4 percent in 2003). This decline in employment-based health insurance coverage essentially explains the drop in total private health insurance coverage, from 69.6 percent in 2002 to 68.6 percent in 2003. The percentage of people covered by government health insurance programs rose in 2003, from 25.7 percent to 26.6 percent, largely as the result of increases in Medicaid and Medicare coverage. Medicaid coverage rose 0.7 percentage points to 12.4 percent in 2003, and Medicare coverage increased 0.2 percentage points to 13.7 percent. The proportion of uninsured children did not change in 2003, remaining at 11.4 percent of all children, or 8.4 million. Source: U.S. Census Bureau web site: http://www.census.gov/Press-Release/www/releases/archives/income_wealth/002484.html, accessed 5/1/2007
Additional Background on Health Insurance, cont. Race and Hispanic Origin The uninsured rate did not change for blacks (about 19.5 percent) or Asians (about 18.7 percent) between 2002 and 2003. (The health insurance coverage rates of blacks and Asians were not different in 2003.) Non-Hispanics who reported white as their only race saw their uninsured rate increase from 10.7 percent to 11.1 percent. The uninsured rate for Hispanics, who may be of any race, was 32.7 percent in 2003 — unchanged from 2002. Based on a three-year average (2001-2003), 27.5 percent of people who reported American Indian and Alaska native as their only race were without coverage, lower than the uninsured rate for Hispanics (32.8 percent) but higher than that of the other race groups. Comparisons of two-year moving averages (2001-2002 and 2002-2003) showed that the uninsured rate for American Indians and Alaska natives did not change. Source: http://www.census.gov/Press-Release/www/releases/archives/income_wealth/002484.html, accessed 5/1/2007
Additional Background on Health Insurance, cont. Regions The South was the only region to show an increase in its uninsured rate in 2003, up from 17.5 percent in 2002 to 18.0 percent. The health insurance coverage rates of people in the South and in the West (17.6 percent) were not different in 2003. The percentages for the Northeast and Midwest were 12.9 percent and 12.0 percent, respectively. Methodology The estimates in the income, poverty and health insurance report are based on the 2002, 2003 and 2004 Annual Social and Economic Supplements to the Current Population Survey (CPS ASEC), which is conducted in February, March and April at about 100,000 addresses nationwide. The CPS is a labor force survey conducted monthly by the Census Bureau for the Bureau of Labor Statistics using Computer-Assisted Telephone Interviewing (CATI) and Computer-Assisted Personal Interviewing (CAPI). The American Community Survey (ACS) is an integral part of the plan to redesign the decennial census and will replace the “long form.” During the 2000-2004 testing program, the ACS has been collecting data from a sample of about 800,000 addresses per year. These estimates are collected on a rolling basis every month. The ACS uses the Census 2000 self-response mail-out/mail-back methodology, followed by CATI, followed by CAPI. Estimates from the CPS ASEC may not match the estimates from the ACS because of differences in the questionnaires, data collection methodology, reference period, processing procedures, etc. As both are surveys, they are subject to sampling and nonsampling errors. All comparisons made in the report have been tested and found to be statistically significant at the 90-percent confidence level, unless otherwise noted. For additional information on the CPS data, visit<http://www.census.gov/hhes/income/p60_226sa.pdf>. For additional information on ACS data, visit <http://www.census.gov/acs/www/UseData/Accuracy/Accuracy1.htm>. Source: http://www.census.gov/Press-Release/www/releases/archives/income_wealth/002484.html, accessed 5/1/2007


![Underage Drinking Prevention in [county]](https://cdn2.slideserve.com/4033887/underage-drinking-prevention-in-county-dt.jpg)