Download
1 / 15
150 likes | 344 Vues
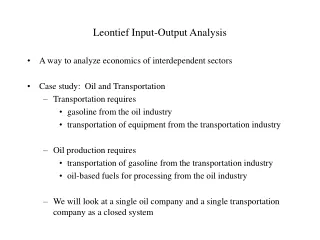
Bilateral trade flows and input-output analysis. Colin Webb OECD STI/EAS. Introduction. 3 rd edition of OECD Input-Output (I-O) database currently being finalised ‘Harmonised’ tables based around the year 2000 and expanded country coverage: 28 OECD countries and 7 non-OECD countries

E N D
Bilateral trade flows and input-output analysis Colin Webb OECD STI/EAS
Introduction • 3rd edition of OECD Input-Output (I-O) database currently being finalised • ‘Harmonised’ tables based around the year 2000 and expanded country coverage: 28 OECD countries and 7 non-OECD countries • STI Working Paper 2006/7 by Wixted, Yamano and Webb discusses a range of uses of OECD’s ‘harmonised’ Input-Output (I-O) tables • OECD’s Bilateral Trade by industry Database (BTD) plays an important role
Role of trade data (1) • Create total transaction matrix by adding import matrix to domestic transaction matrix • Import matrix generated by distributing total imports across industries • Country source tables used where available • Otherwise, tables estimated at OECD • Bilateral trade may play minor role
Uses of National Tables • Simple structural analyses • By converting monetary values in transaction matrix to coefficients (A), a range of nth order effects can be modelled via Leontief inverse (I-A)-1: • Extent to which domestic R&D, or CO2 emissions(or anything), is embodied in domestic output E x (I-A)-1D • Impact of imported intermediates on productivity • Import content of exports • Service sector value added embodied in manufactures
Role of trade data (2) • BTD used to link national I-O tables. via trade flows of goods, to produce international I-O models • BTD and I-O thus have compatible industry lists. • Imports by declaring countries are used to determine shares from partner countries • For trade in services, much estimation required
Uses of Linked I-O Tables • Extending analyses of embodied technology, or CO2, by including technology, or CO2, embodied in imported goods E x (I-A)-1D + ∑Ec x {Mc x (I-A)-1D +Dc} • ‘adjusted’ measures of import content of exports • Identifying and analysing global value chains … • … impacts of international outsourcing (offshoring) – on domestic employment, global greenhouse gas emissions etc … • … inter-dependencies between countries; spatial clusters
Trade balance in CO2 emissions – percentage of domestic production
Limitations of data • Timeliness – I-O tables often released with lag of 5 years … • … and represent fixed point in time • Not enough detail for certain industrial sectors • Product to industry conversion keys can be flawed • Significant presence of re-exports / re-imports • Second-hand goods, recycled materials • Scarcity of bilateral trade in services by industry
Motivation • Many Uses, but also many users … • General increase in use of international linked I-O models to address a wide range of policy issues • High and increasing demand for OECD ‘harmonised’ tables - Over 650 requests for 2002 edition in last 20 months • High response rate to an informal I-O users’ survey – showing strong recognition of OECD’s contribution
Next Steps • Finalise 2006 edition of OECD I-O tables • Release technical documentation as STI working paper • Disseminate new I-O tables (via OLIS etc) • Finalise HSISIC Rev.3 conversion in new system... • … then develop final versions of BTD tables for ‘major’ non-OECD countries • Co-ordination with other organisations to determine feasibility of pooling resources for future development of ‘harmonised’ I-O tables and related data tools.
How can trade statisticians help? • Contribute to country source import matrices to complement benchmark I-O tables • More information concerning re-exports / re-imports • Develop bilateral trade in goods by industry data within national statistical offices • Continue improvements in trade in services data • Raise awareness of potential of international I-O analyses and vital role of bilateral trade data Thank you