Download
1 / 22
220 likes | 310 Vues
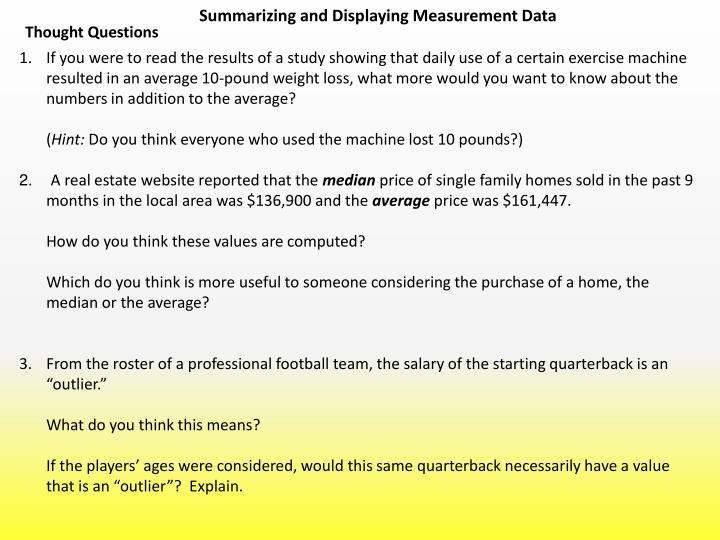
Summarizing and Displaying Measurement Data. Thought Questions. If you were to read the results of a study showing that daily use of a certain exercise machine resulted in an average 10-pound weight loss, what more would you want to know about the numbers in addition to the average?

E N D
Summarizing and Displaying Measurement Data Thought Questions • If you were to read the results of a study showing that daily use of a certain exercise machine resulted in an average 10-pound weight loss, what more would you want to know about the numbers in addition to the average? • (Hint: Do you think everyone who used the machine lost 10 pounds?) • 2. A real estate website reported that the medianprice of single family homes sold in the past 9 months in the local area was $136,900 and the averageprice was $161,447. • How do you think these values are computed? • Which do you think is more useful to someone considering the purchase of a home, the median or the average? • From the roster of a professional football team, the salary of the starting quarterback is an • “outlier.” • What do you think this means? • If the players’ ages were considered, would this same quarterback necessarily have a value that is an “outlier”? Explain.
Summarizing and Displaying Measurement Data A workman is known by his tools. - Anonymous proverb • There are many hundreds of useful tools—statistical methods—for analyzing data and drawing conclusions. • At the most basic level, we use simple, straightforward tools for which pencil-and-paper arithmetic is adequate. • At the other end of the spectrum, we use complex, sophisticated procedures that can require the fastest available computing systems for timely results. • Like all tools, the effectiveness of the statistical methods depends on using them appropriately. • Even such basic arithmetic tasks as counting, adding, subtracting, taking percentages, ranking in order, making plots, and so forth, are tools that help us to understand the messages hidden in the data. • More complex tools are often concerned with summarizing data so that we can draw some conclusions without looking at the data in detail. • Examples of such tools of summarization are mean, median, standard deviation (a measure of the scatter, or dispersion, of the data)
Summarizing and Displaying Measurement Data On the Average • The most commonly used statistical summary measure is a typical value for a set of data. • Why would someone want a typical value for a set of data? • An athlete might want to know the typical time for a particular knee injury to heal. • A regulatory agency might want to know the average cholesterol reduction of a particular drug. • An investor might want to know the typical annual return of mutual funds in an industry sector. • We usually think of the numerical values of data for a single variable as falling along a line. Therefore, we often call a typical value a measure of “location”. • The typical value tells where the numerical values fall along some imaginary axis. In the case of the athlete, the values could be anywhere along an imaginary axis from zero to infinity. • But what is the ”location” of the values reported? Somewhere between 50 and 100 days? Some people will heal in 5 days, others may have to wait as long as 300 days. • We also think of a typical value as a measure of ”central tendency”, showing where the data tend to cluster.
Summarizing and Displaying Measurement Data Statistical Measures – Mean and Median • The data below are the annual salaries of 10 business executives (in thousands of dollars): • Raw data • 890 • 1,110 • 1,460 • 1,420 • 2,000 • 1,430 • 1,520 • 1,110 • 2,400 • 1,680 • The arithmetic mean, usually called the mean or the average, is the sum of all data values divided by the number of such values. • Thus, for the executive salaries, you compute the arithmetic mean by adding up all the salaries and dividing by the number of executives. • In this case, the total for all the salaries is $15 million; divided by 10 you get a mean executive salary of $1.5 million.
Summarizing and Displaying Measurement Data Statistical Measures – Mean and Median • The arithmetic mean has the most meaning when the values are closely centered, with few exceptional values and tending to symmetry about the mean. • But suppose that the one executive who earned $1,460,000 has had a profit-sharing bonanza one year and earned $5 million more for a total salary of $6,460,000 instead of $1,460,000. • While most of the executive salaries are still around $1.5 million and only one other makes more than $2 million, the mean has jumped from $1.5 million to $2 million, an increase in the value of the mean of more than 30%. • Similar situations often arise wherever money or value is involved. Can you think of one?
Summarizing and Displaying Measurement Data The Median • Using the next most common measure of central tendency, the median, avoids this problem. • To get the value of the median, take all the numbers you have collected, and order them by increasing value. • Once the numbers have been ordered, the median is the middle value (if the number of values is odd) or the average of the two middle values (if the number of values is even). • To get the median of the salaries, order the values as shown below: • 890 • 1,110 • 1,110 • 1,420 • 1,430 • 1,460 • 1,520 • 1,680 • 2,000 • 2,400 • Then find the middle value (or as in this case, the average of the middle two values) to get a median executive salary of $1,445,000 ($1,430,000 + $1,460,000 divided by 2).
Summarizing and Displaying Measurement Data The Median • The median is that value that about half the population have values below and half have values above. • Example: In 1994, the median money income of the U.S. households was about $32,300; about half of the 99 million households had money incomes below $32,300 and about half had money incomes above $32,300. • Salary Example • Note that in the original data set, the median of $1,445,000 is only a little less than the arithmetic mean $1.5 million. • But when the one executive's $1,460,000 salary is increased to $6,460,000, the median does not change. • At $1,445,000, the median is still typical of the executive salaries. The mean does change, however, and the new mean of $2 million is not typical
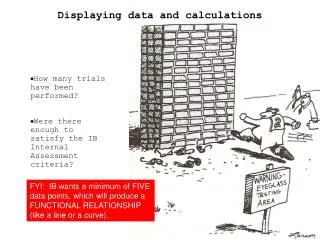
Summarizing and Displaying Measurement Data Displaying Quantitative Data – Histograms and Stemplots Always start the summary of data by making a picture Histograms • First, slice up the entire span of values covered by the quantitative variable into equal-width piles called bins. • The bins and the counts in each bin give the distribution of the quantitative variable. Example: Earthquake Magnitudes • The tsunami of December 26th, 2004, in Sumatra was caused by an earthquake of Magnitude 9.0 • on the Richter scale. • It killed more than 225,000 people, making it the most disastrous tsumani on record. But was the • earthquake that caused it truly extraordinary, or did it just happen at an unlucky place and time? • The U.S. National Geophysical Data Center has information on more than 2400 tsunamis dating • back to 2000 B.C.E., and we have estimates of the magnitude of the underlying earthquake for • 1240 of them
Summarizing and Displaying Measurement Data Example: Earthquake Magnitudes
Summarizing and Displaying Measurement Data Relative frequency histogram A relative frequency histogram displays the percentage of cases in each bin instead of the count.
Summarizing and Displaying Measurement Data Stemplots Stemplots (also called stem-and-leaf displays) show the distribution of a quantitative variable, like histograms do, while preserving the individual values. Example Compare the histogram and stem-and-leaf display for the pulse rates of 24 women at a health clinic. Which graphical display do you prefer?
Summarizing and Displaying Measurement Data Constructing a Stemplot First, cut each data value into leading digits (“stems”) and trailing digits (“leaves”). Use the stems to label the bins. Use only one digit for each leaf—either round or truncate the data values to one decimal place after the stem. Christmas Bird Count Totals 1999 Example Data • The results of the 1999 Laboratory of Ornithology Christmas Bird Count are displayed in the stem and leaf display at the right. • This display uses split stems, to give the display a bit more definition. The lower stem contains leaves with digits 0,1,2,3,4 and the upper stem contains leaves with digits 5,6,7,8,9. • Describe the characteristics of the stem-plot? KEY: 18 | 6 = 186 species spotted
Summarizing and Displaying Measurement Data Constructing a Stemplot Weight Data - STAT 208 Class Survey -- Spring, 1997 -- Virginia Commonwealth University
Summarizing and Displaying Measurement Data Weight Data - STAT 208 Class Survey -- Spring, 1997 -- Virginia Commonwealth University 10 11 12 13 14 15 16 17 18 19 20 21 22 23 24 25 26 10 0166 11 009 12 0034578 13 00359 14 08 15 00257 16 555 17 000255 18 000055567 19 245 20 3 21 025 22 0 23 24 25 26 0 192 5 152 2 135 Key 20|3 means203 pounds Stems = 10’sLeaves = 1’s 2
100 120 140 160 180 200 220 240 260 280 Summarizing and Displaying Measurement Data Weight Data: Frequency Table Weight * Left endpoint is included in the group, right endpoint is not.
Summarizing and Displaying Measurement Data Shape, Center, and Spread When describing a distribution, make sure to always tell about three things: shape, center, and spread What is the Shape of the Distribution? Does the histogram have a single, central hump or several separated humps? Humps in a histogram are called modes. A histogram with one main peak is dubbed unimodal; histograms with two peaks are bimodal; histograms with three or more peaks are called multimodal. Proportion of Wins Diastolic Blood Pressure
Summarizing and Displaying Measurement Data Is the histogram symmetric? If you can fold the histogram along a vertical line through the middle and have the edges match pretty closely, the histogram is symmetric.
Summarizing and Displaying Measurement Data Outliers • Extreme values, far from the rest of the data. • May occur naturally • May occur due to error in recording • May occur due to error in measuring • Observational unit may be fundamentally different Number of Books Read for Pleasure
Summarizing and Displaying Measurement Data Boxplots and the 5-Number Summary The five-number summary of a distribution reports its median, quartiles, and extremes (maximum and minimum). Example: The five-number summary for the daily wind speed is: A boxplot is a graphical display of the five-number summary. Constructing a Boxplot • Draw a single vertical axis spanning the range of the data. • Draw short horizontal lines at the lower and upper quartiles and at the median. • Then connect them with vertical lines to form a box.
Summarizing and Displaying Measurement Data Constructing a Boxplot • Erect “fences” around the main part of the data. • The upper fence is 1.5 IQRs above the upper quartile. • The lower fence is 1.5 IQRs below the lower quartile. • Note: the fences only help with constructing the boxplot and • should not appear in the final display. • Use the fences to grow “whiskers.” • Draw lines from the ends of the box up and down to the most extreme data values found within the fences. • If a data value falls outside one of the fences, we do not connect it with a whisker.
Summarizing and Displaying Measurement Data Constructing a Boxplot • Add the outliers by displaying any data values beyond the fences with special symbols. • We often use a different symbol for “far outliers” that are farther than 3 IQRs from the quartiles. Compare the histogram and boxplot for daily wind speeds:
Summarizing and Displaying Measurement Data Comparing Groups Boxplots offer an ideal balance of information and simplicity, hiding the details while displaying the overall summary information. We often plot them side by side for groups or categories we wish to compare. What do these boxplots tell you?