Download
1 / 18
180 likes | 290 Vues
GMES services and emission inventories workshop – October 2011 -Copenhagen. Emissions of crustal material in air quality forecast systems: Use of satellite observations. Laurent Menut (1), Bertrand Bessagnet (2), Augustin Colette (2), Dmitry Khvorostiyanov (1)

E N D
GMES services and emission inventories workshop – October 2011 -Copenhagen Emissions of crustal material in air quality forecast systems: Use of satellite observations Laurent Menut (1), Bertrand Bessagnet (2), Augustin Colette (2), Dmitry Khvorostiyanov (1) (1) Laboratoire de Meteorologie Dynamique, Institut P.S.Laplace, Palaiseau, France (2) INERIS, Chronic Risks Division,Verneuil en Halatte, France
Mean parameters and uncertainties Meteorology: Transport, turbulence Clouds and radiation, precipitations Emissions: Anthropogenic (traffic, industries) Biogenic (vegetation) Natural (dust, fires, volcanos) Chemistry-transport model Use of model outputs: Analysis Direct: model vs measurements Indirect: from model to observations Forecast: Short term: air quality, accidental releases Long term: climate change Scenarios: Economical and/or health impacts Climate change Gas and particles concentrations
The CHIMERE chemistry-transport model CHIMERE is: • Off-line coupled with models such as ECMWF IFS, MM5, WRF etc. • Use prescribed emissions fluxes • Estimates concentrations fields of more than 50 gaseous and aerosols species - Managed by a developer team IPSL/INERIS - More than 100 users registered on the email list - Used by more than 20 institutes for forecast - Used by more than 15 institutes for research Involved in numerous European projects: GEMS, PROMOTE, City-Delta, Euro-Delta, CIRCE, AMMA, GEOMON, NATAIR... Daily used for forecast: - For France with the PREVAIR system, operated by INERIS - In Europe: GEMS and MACC projects - Northern Atlantic: dust (LMD + SDS-WMO) A model in free access (source code + documentation + test cases) http://www.lmd.polytechnique.fr/chimere
Is dust long-range transport necessary for local air quality analysis/forecast? 1st step: Lidar measurements and surface concentrations The SIRTA (Palaiseau) backscatter lidar Climatology: Lidar data and PM10 surface concentrations [2003 - 2006] Red line: No dust residual layer Black line: dust layer detected + mixing height reaching altitude of dust layer The local impact of dust layer entering the boundary layer is well marked Colette A., Menut L., Haeffelin M., Morille Y., 2008, Impact of the transport of aerosols from the free troposphere towards the boundary layer on the air quality in the Paris area, Atmospheric Environment, Vol 42/2 pp 390-402, DOI: 10.1016/j.atmosenv.2007.09.044
Extreme event example: The volcanic ash SIRTA observatory (IPSL) and CHIMERE (LMD/IPSL/INERIS) SIRTA backscatter lidar Lidar informations: - Plume altitude - Plume thickness - Optical properties - Interactions plume / boundary layer But, missing informations: - Trajectory? - Concentrations? - Composition? - Deposition rate? CHIMERE tracer experiment Colette A., O.Favez, F.Meleux, L.Chiappini, M.Haeffelin, Y.Morille, L.Malherbe, A.Papin, B.Bessagnet, L.Menut, E.Leoz, L.Rouil, 2011, Assessing in near real time the impact of the April 2010 Eyjafjallajokull ash plume on air quality, Atmospheric Environment, 45, 1217-1221
Main challenges for emissions and transport of 'natural' particles The problem of “sporadic” emissions of fires, dust, volcanic ashes: - when and where are really these sporadic emissions? - what is the emitted mass? → required to prescribe the local modelled vertical flux - what is the flux composition? → required for chemical interactions (if any) - what is the size distribution? → required for optical properties, transport, sedimentation - what is the plume altitude and thickness? → required for long-range transport
Starting from the source: Development of CHIMERE-DUST for a deterministic estimation of dust emissions and long-range transport A direct comparison shows a good agreement for large scale and vertically integrated aerosols.... But open questions remain on: - The vertical profile structure - the aerosols composition, - their radiative properties
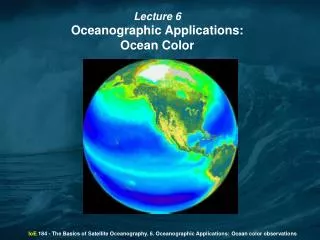
Use of satellite: Validation of large scale spatial structures for several types of events. But.... validation using AOT only is very sensitive to hypotheses done on mineralogy, size distribution. No direct information on the source.
Use of satellite: Vertical structure → lidar on-board satellite Statistics of dust layers between CHIMERE-DUST/CALIPSO Plume transport and optical properties of particles Development of model to observations algorithms → comparisons and validation of meteorological (WRF) and chemistry-transport models (CHIMERE) Iso-longitude dust occurrence statistics: June-September 2006 CALIOP Model to observations simulator: Model ability to estimate hourly mineral dust emissions and atmospheric burden. CTM are generally too much vertically diffusive... CHIMERE-DUST Vuolo M.R., H.Chepfer, L.Menut and G.Cesana, 2009, Comparison of mineral dust layers vertical structures modelled with CHIMERE-DUST and observed with the CALIOP lidar, Journal of Geophysical Research - Atmospheres , Vol. 114, D09214, doi:10.1029/2008JD011219
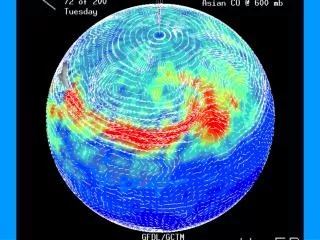
Use of satellite with vertical profiles (CALIOP): Discriminate long-range transport and “local” emissions CALIOP lidar Saharan dust Chernozemic surface dust CHIMERE model Huge Ukrainian dust event in March 2007 CHIMERE Bessagnet B., L.Menut, G.Aymoz, H.Chepfer and R.Vautard, 2008, Modelling dust emissions and transport within Europe: the Ukraine March 2007 event, Journal of Geophysical Research - Atmospheres, 113, D15202, doi:10.1029/2007JD009541
Quantification of the model uncertainty: Mineral dust emissions and transport analysis Mineral dust concentrations are sensitive to: - The meteorological forcing (U10m) - The soil and surface database - The Dust Production Scheme Example: Two meteorological forcings (ECMWF and NCEP/MM5) Two dust saltation and sandblasting parameterizations (MB95 and AG2001) Two major peaks observed with AERONET: 22 Feb and 6 March 2006 Only one well modelled with each meteorological forcings: the problem of the threshold schemes Menut L., 2008, Sensitivity of hourly Saharan dust emissions to NCEP and ECMWF modeled wind speed. Journal of Geophysical Research.
Quantification of the model uncertainty: Mineral dust emissions and transport forecast Each day, a new dust forecast: - starting [D-1], use of NCEP meteo fields analysis - ending [D+3] - Superposition of leads corresponding to one time
Quantification of the model uncertainty: Mineral dust emissions and transport forecast Variability of the 10m wind speed near sources: for meteorology, “acceptable”... What about diagnosed dust emissions fluxes? Menut L., I. Chiapello and C. Moulin, 2009, Previsibility of mineral dust concentrations: The CHIMERE-DUST forecast during the first AMMA experiment dry season , Journal of Geophysical Research - Atmospheres, 114, D07202, doi:10.1029/2008JD010523
Quantification of the model uncertainty: Mineral dust emissions and transport forecast Impact of wind speed variability on dust emissions Dust emissions are parameterized using the [Alfaro and Gomes, 2001] scheme Fv=f(soil,u*>u*T) A threshold problem The “low” meteorological uncertainty becomes a “large” vertical dust flux uncertainty.
Quantification of the model uncertainty: Mineral dust emissions and transport forecast Impact of dust emissions variability on surface dust concentrations Near sources Near sources: The variability is different from day to day and site to site.... The concentrations may suddenly be very large: realistic?? The differences between concentrations may be very large: Example, Djougou: 1st day ~ 600 ug/m3 Following days: 100 or 300 ug/m3
Quantification of the model uncertainty: Mineral dust emissions and transport forecast Impact of dust emissions variability on surface dust concentrations After transport, in Europe After transport, in Europe: The same variability is “long-range transported”. The uncertainty is of the same order of magnitude than the actual PM limitations for air quality... Dust forecast is not enough stable for air quality forecast over Europe!
Conclusion and perspectives: What can we do to reduce this uncertainty?Potential benefit of satellite data Development of mineral dust emissions database for Europe: - same dust production scheme than in Africa + taking into account vegetation, forest, soil humidity (after rain), different soil mineralogies (e.g Chernozemic soils) + taking into account modelled wind biases (different in Africa and Europe) Satellite is useful for: - Identify soil and surface properties (mineralogy, vegetation) - Identify major dust events location and long-range transport (AOT, with OMI, MSG) - Vertical layers identification (CALIOP) But remains difficult to use for the local dust sources: - Magnitude of the vertically emitted flux - Size distribution and composition of this flux - Connect the wind speed and the dust flux to improve dust schemes (no wind speed measurements) - and clouds? and precipitations? Need to develop model-2-obs systems with both clouds and aerosols
Conclusion and perspectives: What can we do to reduce this uncertainty?Potential benefit of satellite data Project (but no funding actually): Coupling NRT satellite data and CHIMERE model to improve the short-term forecast (i.e 1 to 3 days): Make statistical budgets to optimize mineral dust vertical fluxes - Run the model to produce a 'first guess' forecast - Produce 'model to observations' outputs to have 'modelled lidar profiles' - Compare model and NRT satellite data - Identify missing sources or plumes (same depth above ground and optical properties) - Try to update existing plumes (location, altitude, concentration) - Re-initialize forecast with this improved field. - Statistically: Try to update surface characteristics (u*T versus forecasted wind)