Download
1 / 54
540 likes | 703 Vues
Southern and Mediterranean Europe a market in transition. Paolo Tabarelli de Fatis Vestas Mediterranean East, Italy President. Athens, 1 March 2006 EWEC 2006. Mediterranean wind markets Markets status International financing mechanisms in the Mediterranean area EU export strategy

E N D
Southern and Mediterranean Europe a market in transition Paolo Tabarelli de Fatis Vestas Mediterranean East, Italy President Athens, 1 March 2006 EWEC 2006
Mediterranean wind markets • Markets status • International financing mechanisms in the Mediterranean area • EU export strategy • Vestas experience in the Mediterranean area • Future trends and scenario
Total accumulated installed capacity GW 137,0 3,0 7,2 117,1 Others 2,2 14,3 OECD-Pacific 5,9 99,5 11,7 1,6 South & East Asia 4,7 83,9 9,8 Europe 1,2 70,7 3,7 0,8 America 8,0 85,2 2,9 58,2 0,6 6,4 74,6 47,9 2,2 0,4 5,0 64,4 39,8 1,6 0,3 55,0 3,8 31,4 1,1 47,1 2,7 24,2 40,4 17,4 34,7 28,8 12,9 27,3 22,6 19,0 16,0 13,4 7,4 10,0 6,9 1999 2000 2001 2002 2003 2004 2005 2006 2007 2008 2009 2010 Wind market in the world, installations and forecast • Average growth rate of 16,6% in the period 2005-2010 • European Market more developed but Asia market in strong development • Off-shore installations in growth • The growth will be also determined by the application of the Kyoto Protocol Flexible Mechanisms *Source: BTM Consult 2005 **Forecast in the years 2005-2010 and real installations in the years 1999-2004
Market shares on total capacity installed by 31 December 2004 Accu. 2004 (MW) 36,7% 17.580 Vestas (DK) 7.045 14,7% Enercon (GE) 13,4% 6.438 Gamesa (ES) 5.346 11,2% GE Wind (US) 3.874 8,1% Siemens (DK) 2.406 5,0% Nordex (GE) 1.169 2,4% Repower (GE) 1.019 2,1% Mitsubishi (JP) 1,6% 785 Suzlon (Ind) 744 1,6% Ecotecnia (ES) World wind market, market shares year 2004 • 47.911 MW by the end of 2004 • 8.154 MW installed in the year 2004, growth rate of 20,5% • Vestas keeps its leadership position with a market share of 36,7% *Source: BTM Consult 2005
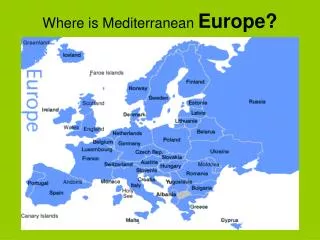
10.027 Spain North Med 14.110 MW Italy 1.711 South Med 249 MW Portugal 1.022 Tot Med 14.359 MW France 757 Greece 590 Egypt 145 Morocco 53 North Med Tunisia 20 South Med Turkey 20 Israel 8 Cyprus 2 V80-2.0 MW Italy Bulgaria 1 Mediterranean area wind markets, year 2005 Total accumulated capacity by 31 Dec 2005 MW
Total accumulated installed capacity ≈36.770 40.000 ≈ 1.070 ≈ 1.200 35.000 Others* Egypt, Morocco, Tunisia 30.000 ≈ 9.300 Greece, France, Portugal Italy 25.000 Spain (MW) ≈ 5.200 20.000 15.000 10.000 ≈20.000 5.000 2004 2005 2006 2007 2008 2009 2010 Mediterranean area wind markets, scenario by 2010 • National renewables targets by 2010 (European Directive 2001/77/CE) for the European countries of the Med area • European Markets are more developed but North Africa countries markets and Turkey market are in strong development • North Africa countries renewables targets by 2010 have been defined and many projects are in the pipeline *others= Cyprus, Malta, Bulgaria, Turkey, Libya, Algeria, Lebanon, Syria, Jordan, Israel
Italy, market status • Target • National target of 22% of renewables by 2010 (EU directive 2001/77/EC) • Target of 2500 MW of wind installations by 2010 according to the Italian White Paper 1999 (If the present trend continues the target will be already reached in 2007) Legislative framework and incentives • National Decree 387/03 for the promotion of renewables • Green Certificates System and compulsory renewables quota system Market status • Interest of investing in wind farms is growing (both national and foreign investors), even if the wind conditions are in the range of low wind sites • Trend is moving towards larger MW turbines • Barriers • Regional authorization obstacles (i.e Sardinia and Puglia) • Local acceptance • Grid connection and grid development
Tot by 31 Dec 05 (MW) Vestas 1066 Enercon 228 Gamesa 202 GE Wind 77 Repower 40 Siemens 29 Fuhrlander 15 Others 55 Tot 1711 Fuhrlander 0,9% Siemens 1,7% Repower 2,3% others; 3,2% GE Wind 4,5% Gamesa 11,8% Vestas 62,3% Enercon 13,3% V80-2.0 MW Italy Italy, market shares Market shares on total capacity by 31 December 2005 • Capacity installed in 2005 of 446 MW • Growth rate in 2005 of about 35% *Source: Wind installations connected to the grid, Pirazzi-ENEA (Italian National Agency for New Technologies Energy and Environment) and Vestas Track record
Greece, market status Target • National target of 20% of renewables by 2010 (EU directive 2001/77/EC) • National target of 29% of renewables by 2020 • Legislative framework and incentives • Law 3299/2004 provides financing support up to 50% of the total investment by grant • New Legal Framework of Licensing*: feed in tariff of 68,4 Euro/MWh (mainland) and 84,6 Euro/MWh (islands) • Market status • Interest of investing in wind farms is growing (both national and foreign investors) Barriers • Complicated procedures in order to obtain authorizations • Inadequate electrical network to absorb the power produced • Local Acceptance **To be adopted in the first quarter 2006
Tot by 31 Dec. 2005 (MW) Market shares on total capacity by 31 December 2005 Others 8,7% Vestas 260 Siemens 188 Nordex 4,8% Enercon 62 Nordex 28 Enercon 10,6% Others 51 Vestas 44,0% 590 Tot Siemens 31,9% V52-850 kW Greece Greece, market shares • Capacity in the years 2005 of 103 MW • Growth rate in 2005 of about 20% *Source: Wind installations with operation license, CRES (Center for Renewable Energy sources), February 2006
Bulgaria, market status Wind potential • According to a study of Bulgarian Academy of Sciences: wind potential 2.200 – 3.400 MW and wind speed 6 –13 m/sec Legislative framework and incentives • Bulgaria ratified Kyoto Protocol and JI flexible mechanism is applicable • A New legislative framework is going to be approved to synchronize the Bulgarian energy system with EU directives • At the moment there are no specific incentives for the development of wind farms Market status • There are no operational wind power plants • As Bulgaria is a EU candidate, EIB and EBRD have loans dedicated to Bulgaria Barriers • Lack of incentives and support programs • Lack of wind data *Source: EBRD (European Bank for Reconstruction and Development)
Turkey, market status Target and wind potential • Technical Potential 88.000 MW* • Turkey is the second most powerful wind market in Europe area after UK* Legislative Framework and incentives • Renewable Energy law (May 2005): feed in tariff equal to the average wholesale price of the previous year (about 55 Euro\MWh) for the first 7 years • Obligation on retail company to purchase renewable energy from producers Market status • 1.250 MW have obtained licenses** and more than 3.000 MW are applying for licenses** • The prospect developers are foreign and Turkish private companies • Barriers • Inadequate grid infrastructure • Low price for power and local currency of the PPA (Power Purchase Agreement) • Weakness of the local bank system * Source European Commission study/Wind Force 12 2005 ** Source: Wind Force 12 2005 of GWEC (Global Wind Energy Council)
Market shares on total capacity by 31 December 2005 Tot by 31 Dec 2005 (MW) Vestas 36% Vestas 7 Enercon 13 Tot 20 Enercon 64% V52 850kW Turkey, market shares *Source: EWEA (European Wind Energy Association) 2004
Egypt, market status Wind potential and target • Risø wind atlas: theoretical wind potential of 20.000 MW, average wind speed 7-11 m/s • Target of 850 MW by 2010 • Legislative Framework • Egypt ratified Kyoto Protocol and CDM flexible mechanism is applicable • Egypt has a target of 3% from renewables by the year 2010 • Establishment in 1986 of NREA (New Renewable Energy Authority) • Market status • Installed capacity by 31 Dec 2004 of 145 MW, 63 MW in co-operation with Denmark and 80 MW in co-operation with Germany • Future co-operations: 120 MW with Japan, 85 MW with the Spain, 80 MW with Germany, and other 120 MW with the Denmark • Barriers • Price of power from wind close to the cost of production from conventional sources • Institutional barrier: lack of support program for the private sector • Lack of investors’ awarness about wind technology *Source: OME (Observatoire Méditerranéen de l'Energie), Risø (Denmark)
Market shares on total capacity by 31 December 2005 Tot by 31 Dec 2005 (MW) Vestas 79 Nordex 45,5% Nordex 66 Tot 145 Vestas 54,5% V47-660 kW Egypt Egypt, market shares *Source: OME (Observatoire Méditerranéen de l'Energie), Risø (Denmark)
Tunisia, market status Wind potential and target • Wind potential of 2.000 MW (preliminary wind studies), average wind speed 7-10 m/s • Target of 300 MW by 2010 • Legislative Framework and incentives • Tunisia ratified Kyoto Protocol and CDM flexible mechanism is applicable • Private investors: IPP (Indipendent Power Producers), PPA (Power Purchase Agreement) of about 30 Euro\MWh • Establishment of ANER (National Agency for Renewable Energy) • Market status • Total capacity by 31 December 2005 of 20 MW • By the year 2010 100 MW are expected to be realized by IPP and 200 MW by Steg (Societè Tunisienne de l’Electricitè et du gaz) • Barriers • Price of power from wind close to the cost of production from conventional sources • Lack of a regulatory framework specific for wind development • Inadequacy of the local expertise *Source: OME (Observatoire Méditerranéen de l'Energie), UNDP (United Nation Enviromental Programme)
Morocco, market status Wind potential and target • Wind potential of 6.000 MW, average wind speed 8-11 m/s • Target of 1000 MW by 2010 • Legislative Framework • Morocco ratified Kyoto Protocol • Establishment of CDER (Centre for Development of RES) • Renewables development plan: target of 10% by the year 2010 • Market status • By 31 December 2005 total capacity of 53 MW • Koudia al Baida wind farm 50W, 84 Vestas V42 600kW • 5 other projects in development for a total capacity of 270 MW Barriers • Price of power from wind close to the cost of production from conventional sources *Source: OME (Observatoire Méditerranéen de l'Energie), MoroccoMinistry of Land-Use Management, Water and the Environment
Spain, market status • Target • National target of 29,4% of renewables by 2010 (EU directive 2001/77/EC) • New target for wind installations of 20.155 MW by 2010 Legislative framework and incentives • PER - Plan de Fomento de las Energías Renovables • The current feed in tariff is maintained under the new regulation Market status • The PER provides a stable framework for future development of the wind industry • The trend goes towards MW WTGs • About 1500 MW were installed in 2005 and future perspectives are at to be at or above this level • Cataluna e Andalucia have been a significant growth in 2005 and the regions more active confirmed their growth in 2005 • Barriers • Extension of grid in the same growth rate as the target for wind
Market shares on total capacity by 31 December 2005 Enercon 0,3% Others 5,0% Nordex 0,3% Siemens 3,3% Gamesa 62,1% Ecotecnia 8,5% GE Wind 7,6% Vestas 12,9% V82-1,65 MW Spain Spain, market shares Tot capacity by 31 December 2005 (MW) 10.027 • Capacity installed in 2005 of 1764 MW • Growth rate in 2005 of about 21% *Source: AAE (Asociacion Empresarial Eolica) for market shares and EWEA for market size
Portugal, market status • Target • National target of 39% of renewables by 2010 (EU directive 2001/77/EC) • National Target for wind installations 5100 MW by 2010 Legislative framework and incentives • Feed-in tariffs for a 15 year term, reduction on new projects • State grants on a project-by-project basis (≈ 10% investment) Market status • High growth experienced in 2005 with a doubling of installed capacity: from about 500 MW to about 1000 MW • Growth driven primarily by developers • Public Tender of 1.500 MW for projects to be installed in 2008-2013. Barriers • Time taken to get the licences (grid connection licenses, environmental permits, construction permits) • Accommodation of increased wind capacity by the national grid operator
Portugal, market shares Market shares on total capacity by 31 December 2005 Tot capacity by 31 December 2005 (MW) Repower Others 2,50% 3,70% 1.022 Siemens Enercon 4,20% 30,30% GE Wind 7% Nordex 12,20% Gamesa Vestas 27,20% 12,90% • Capacity installed in 2005 of 500 MW • Capacity nearly doubled in 2005 V90-3.0 MW Portugal V82-1.65 MW Portugal *Source: INEGI (Instituto de Engenharia Mecanica e Gestao Industrial) for market shares and EWEA for market size
France, market status • Target • National target of 21% of renewables by 2010 (EU directive 2001/77/EC) Legislative framework and incentives • Feed in tariff for a 15 year term and depending on the productivity of the sites • Progressive yearly reduction of the tariff Market status • Total accumulated capacity by 31 December 2005 of 757 MW* • Installed capacity of 367 MW* in the year 2005 represents a doubling of the total installed capacity • High market growth expected within the coming years • Two calls for tenders of French Government designed to approve up to 500 MW of projects • Barriers • Administrative barriers especially the building permit procedure * Source EWEA
Other Mediterranean countries, market status Israel • By 31 December 2005 total capacity of 8 MW • IEC is planning to develop 2 wind farms by 2010: 50 MW and 100 MW • Efforts to create conditions suitable for IPP (Indipendent Power Producers) Syria • Wind atlas have been developed with the support of Risø (Denmark) • Technical wind potential of 40.000 MW • Target of 800 MW by 2011 Lebanon • 2 projects in development for about 40 MW • Lebanon is approving an incentives scheme: PPA (Power Purchase Agreement) of about 65 Euro/MWh and only autoproducers can develop wind farms Cyprus • National target of 6% of renewables by 2010** • Wind potential of 150-250 MW for on-shore installations, wind speed 5-7 m/sec** **Sources Report 05 by Cyprus to the EC on the Implementation of Directive 2001/77/EC
International financing mechanisms in the Mediterranean area
Kyoto Protocol, status of the ratification** Annex 1* countries Main countries in the world Mediterranean Countries Mediterranean Countries which have not ratified • Turkey • Canada • Japan • Russia • Ucraina • European Union (25 countries) • Bulgaria • France • Portugal • Spain • Greece • Italy Non Annex 1* countries Mediterranean Countries Mediterranean Countries which have not ratified Main countries in the world • Libya • Lebanon • Syria • Egypt • Morocco • Tunisia • Algeria • Jordan • Albania • Cyprus • Malta • Brazil • Chile • China • India *Annex 1 are the developed countries and Non-Annex I countries are the developing countries or less developed countries ** Source UNFCC (United Nations Framework Convention on Climate Change)
Clean Development Mechanism (CDM) Development of a CDM project in a Non-Annex 1* country and issue of the CERs Conversion of the Certified Emission Reductions (CERs) in Assigned Amount Units (AAUs) Companies with Kyoto obligations of Annex 1* countries Project Developer Trading of Certified Emission Reductions (CERs) Trading of Certified Emission Reductions (CERs) Use of the Certified Emission Reductions (CERs) to satisfy Kyoto Protocol obligations Countries Annex 1* *Annex 1 are the developed countries and Non-Annex I countries are the developing countries or the less developed countries
Wind farm • Project promotor and developer • Production • Financing • Load factor • Status • Emission factor • Emission reductions (CERs) • Emission reductions turnover • % Total Turnover from CERs (10 years) on Total Investment Costs ** • % Yearly Turnover from CERs on Yearly Power Turnover ** Essaouria 60 MW ONE (Office National d’Electricité) 210 GWh/year KFW soft Loan 40% Registered by the CDM Executive Board 0,72 ton CO2/MWh 1,5 Mil ton CO2 for 10 years 15 Mil Euro CO2 for 10 years 20% 24% Clean Development Mechanism in Morocco, Essaouira wind farm *Source: Project Design Document for CDM **Hypothesis: power price=30 Euro/MWh, Tot investment costs=1,3 Mil Euro/MW, CERs price=10 Euro/ton
Price of the Emission Reductions CDM projects development is risky • Project risk • Country risk • Registration risk Legislative framework uncertainties • Kyoto Protocol obligations beyond 2012 have not been defined • (NAP) National Allocation Plans are not completely defined Registration process is slow and bureaucratic • Average CERs price(Certified Emission Reductions) of about 10-15 $/ton* • Average AAUs price (Assigned Amount Units ) of about 30 Euro/ton (July 05)* • Gap between price of CERs and price of AAUs (about 20 Euro/MWh) *Source: Japan Bank for International Cooperation, November 2005
Advantages, disavantages and future perspectives of the CDM Disadvantages • At the present the CDM does not provide a sufficient incentive to develop a wind farm in the developing countries Advantages • Emission Reductions turnover comes from developed countries and is made in “strong currencies” • The wind sites in the South Med countries have an high production (load factor of 35%-40%): the trading of the Emission Reductions can help to cover part of the wind farm costs (about 15-20%) • Possible future increase of the Emission Reductions price Future perspectives To carry out the increase of the Emissions Reductions price is necessary • To reduce the legislative framework uncertainties (definition of the obligations for the years beyond 2012) • To make more effective and more simple the rules and the registration process for the CDM
TRECs Tradable Renewable Energy Certificates Trading of the TRECs by bilateral contracts to private companies of the Potential Partner Country Development of a wind project in a North African country (Host country) and issue of the TRECs Trading of the TRECs in a “common market” Critical points • Grid connection between the Host Country and the Potential Partner Country (not essential) • Energy policy of the Host country harmonized with the energy policy of the Potential Partner • Establishment of a treaty between the Government of the Host country and the Government of the Potential Partner to confirm the legitimacy • Reliable Certification system
Export strategy and developing policy of European Union Report of EU, 29 September 2005 • Huge potential for cooperation between EU countries and South Med countries • EU to help foster the use of renewables energies in developing countries • Leading financing institutions as the EIB, the EBRD, the World Bank and national export credit agencies to assign priority to investment in renewables and in the South Med countries Advantages for the South Med countries • Local industry, local employment, poverty allievation, conflict prevention, sustainable development, emission reductions Advantages for EU countries • Export opportunities for EU companies: equipment supply, resources assessment & mapping, site selection, micrositing, operation & management project management, project appraisal and planning • Possible future import of energy from the South Med countries
V47-660 kW Egypt Export strategy tools • EIB (European Investment bank) • EBRD (European Bank of Reconstruction and Development) • FEMIP (Facility for Euro-Mediterranean Investment and Partnership) • IFC (International Finance Corporation) • MIGA (Multilateral Investment Guarantee Agency) • World Bank International Financing Institutions Loans e guarantees: Export credits Mixed Credits Soft loans
Vestas experience in the Mediterranean area and case studies
Zafarana wind farm Egypt (1\2) Wind Farm • 46 Vestas V47, 660 kW (sponsor Denmark) • 71 Vestas V47, 660 kW (sponsor Germany) • Installed capacity 77 MW Power production • Average wind speed 10 m/sec • 280 GWh/year • Load factor 42% Emissions reductions • 145.000 ton CO2/year* V47-660 kW Egypt *Considering an Emission Factor of 0,52 ton CO2/MWh
Zafarana wind farm Egypt (2\2) Operator NREA (New and Renewable Energy Authority) Tender NREA has managed the international tenders Construction • Project with sponsor Germany Consortium Vestas, ABB and Kolaly Engineering • Project with sponsor Denmark Vestas as main contractor and local companies as subcontractors Financing DANIDA (Danish International Development Agency) and KFW Soft Loans
Zafarana wind farm Egypt, local industry Towers Transport • Inland transportation Civil works Installation • Roads • Foundations • Site offices • Storage Area • Cranes • Erection* • Commissioning* Electrical works Services • Cables • Transformers • Substation • Operation & Maintenance* • Repair* • Monitoring* *training carried out in Vestas centres
Vestas Mediterranean East • Vestas Mediterranean East Sales and Services Unit • Production Unitfor all the world of the V52 850 kW turbines • Headquarter Taranto (Italy) • Europe: • Italy • Greece • Turkey & Cyprus • South Balkans’ Area • Africa: • Egypt • Libya • Tunisia • Lebanon • Middle East: • Israel, Gaza & Jordan • Iran, Iraq & UAE • Syria, Kuwait, Bahrain • Oman & Quatar
Vestas Mediterranean West Vestas Mediterranean West • Vestas Mediterranean West Sales and Services Unit • Production Unit of the V82-1,65 MW turbines and control systems • Headquarter Barcelona (Spain) • Sales and Service offices: Brazil, Argentina, Maia (Portugal), Montpellier (France), Madrid and Zaragoza (Spain)
Wind industry in Italy • 2 Sites in Taranto (South Italy) • Production start in 1998 • Production of approx. 400 units/year • Only factory of Vestas Group in all the world specialized in the manufacturing of the V52 - 850 kW turbines • The number of workers of the factory is 500 units and the number of indirect workers is estimated about 2000 units V52 850 KW factory
Wind industry in Spain V82 – 1,65 MW factory • 2 Sites in Viveiro in Galicia (North of Spain) and in Olvega (Soria) • Production start in 1998 • Production of approx. 300 turbines/year and 400 panels/year • The number of workers of the factories is 155 units V90 factory • Site in Villadangos (León) • Opening estimated 1st quarter of 2006 • Production of approx.300 units/year • The number of workers estimated of the factory will be 150 units
EU 15, renewables market status and targets (1/2) Present status and target by 2010 • Renewables target of 22,1 % by 2010 (Directive 2001/77/CE) • Hydro, geothermal and photovoltaics are in line with the expectations • Wind is the fastest growing electricity generation technology and it has been underestimated in the target • Biomass is below the target • The renewable target will be met if the measures set out in the directive are fully implemented and some additional misures are taken • A part of the overestimation of biomass could be balanced by the underestimation of wind energy Target by 2020 • Renewables target of 33% by 2020 (EUReport,29 September 2005)
Total accumulated installed capacity 30.000 28.000 ≈ 4.900 France 26.000 Portugal 24.000 Spain 22.000 ≈ 2.500 20.000 (MW) 18.000 16.000 14.000 12.000 10.000 ≈20.000 8.000 6.000 4.000 2.000 - 2004 2005 2006 2007 2008 2009 2010 Spain, Portugal and France future trends and scenario To develop further on wind markets in Spain, Portugal and France it is necessary • Spain: to extend the grid in the same growth rate as the target for wind • France: to reduct the administrative barriers and reinforce the incentives scheme • Portugal: to reduct of the administrative barriers and to develop the grid
Total accumulated installed capacity 8000 7000 Greece ≈ 1.900 6000 Italy 5000 (MW) 4000 3000 ≈ 5.200 2000 1000 0 2004 2005 2006 2007 2008 2009 2010 Greece and Italy future trends and scenario To reinforce wind markets in Italy and Greece is necessary: • to improve Authorization process • to create a favourable climate of opinion on wind development • to improve grid connection and grid development rules • to develop further on the grid • to increase National Targets for wind installations
Electricity Generation in MENA countries, year 2003 Tot year 2003 724 TWh Hydro 4,3% Other renewables 0,1% Nuclear 0,0% Coal 6,6% Gas Oil Coal Hydro Other renewables Nuclear Oil 33,0% Gas 56,0% Middle East and North Africa Countries, energy needs (1\2) • Present Power Production mainly from conventional sources • Low cost for power production from conventional sources but the price of oil will increase in the future because of the oil reserves exhausting • Middle East and North Africa Countries are exporters of gas and oil and they will be crucial to satisfy the growing world energy needs *Source: World Energy Outlook 2005 reference scenario IEA (International Energy Agency)
1.799 1.443 1.028 724 41 1971 2003 2020 2030 2010 Middle East and North Africa Countries, energy needs (2\2) Electricity Generation in MENA countries TWh Strong growth of the electricity generation and consumption • Electricity generation growth per year: (years 1971-2003) +9,4%; (years 2003-2010) +5,1%; (years 2003-2020) +4,1% • Electricity consumption growth per year: (years 1971-2003) +9,2%; (years 2003-2010) +5,3%; (years 2003-2020) +4,3% *Source: World Energy Outlook 2005 reference scenario IEA (International Energy Agency)
Middle East and North Africa Countries, wind development • Huge potential for wind development and wind studies has been carried out: potential of 12.000 MW by 2020 in South-East Mediterranean Countries* • Wind power can serve a good part of the energy needs • Great interest in wind and renewables technologies of the Local Governments • The targets by 2010 for wind and renewables have been defined • National Authoritiesfor the promotion of the renewables have been established • Numerous studies and pilot projects *Source: MEDREP (Mediterranean Renewable Energy Program)