Download
1 / 39
390 likes | 541 Vues
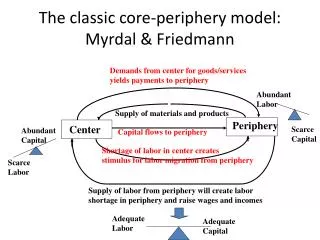
The RES potential of the Europe’s maritime periphery. Dr. Eng. Gonzalo MOLINA IGARTUA Head of Unit Management of Energy RTD programmes CPMR WORKING GROUP SEMINAR ENERGY FOR THE PERIPHERY PAMPLONA 5-6 OCTOBER 2006. Directorate-General for Energy and Transport. Bioenergy. Wind. Grid issues.

E N D
The RES potential of the Europe’s maritime periphery Dr. Eng. Gonzalo MOLINA IGARTUA Head of Unit Management of Energy RTD programmes CPMR WORKING GROUP SEMINAR ENERGY FOR THE PERIPHERY PAMPLONA 5-6 OCTOBER 2006 Directorate-General for Energy and Transport
Bioenergy Wind Grid issues Polygeneration Ecobuildings Renewable energy Sources Solar Th Ocean Geothermal PV Energy Efficiency 2
Overall Energy statistics dataRES EU25, 1990-2002 Current trend: 75-80 Mtoe/ 2010 Source: EUROSTAT Directorate General for Energy and Transport
DEMAND MANAGEMENT AND RENEWABLE ENERGIES (1) The Green Book on Security of Energy Supply considers: 1°The supply from renewables and the demand management (energy efficiency) are essential components for this security 2°Only the integrated use of all political and market instruments can help to increase this security n° 4 Directorate General for Energy and Transport
DEMAND MANAGEMENT AND RENEWABLE ENERGIES (2) How to succeed with the difficult actions in buildings and transport?: • Adequate integration supply/demand: role of RES and EE • Adequate integration of instruments according to each specific circumstance : • Legislation • Market mechanisms: - Technological innovation - Non-technological instruments: • Innovative financial schemes • Training, behaviour… • Standards, monitoring and targetting… • Other n° 5 General Directorate for Energy and Transport
The relation between community instruments Energy Policy: To solve problems and needs of society Research Policy: Development of new technologies DG TREN DG RTD Market COST OF RES ECOBUILDINGS CONCERTOCIVITAS ALTERNATIVE FUELSPOLYGENERATION LEGISLATION IEE Dissemination Demonstration Research and Development Short term Medium term Long term n° 6 General Directorate for Energy and Transport
POLITICAL AND LEGISLATIVE INSTRUMENTS (1) n° 7 General Directorate for Energy and Transport
INTELLIGENT ENERGY. EUROPE: THE FACILITATOR PROGRAMME: Key actions in IEE Legislative inputs Retrofitting of social housing SAVE (+3) IEE Best adequate integration of instruments RTD inputs RES – electricity ALTENER (+3) New instruments created by the IEE programme: - Knowledge - Behaviour - Monitoring - Training - Financing - Other Alternative Fuels for vehicles STEER (+2) Urban and Periurban areas COOPENER (+2) n° 8 8 General Directorate for Energy and Transport
SOLAR ENERGY Directorate-General for Energy and Transport
SOLAR ENERGY POTENTIAL • Solar electricity: PHOTOVOLTAICS • White Paper objective 2010: 3 GW (5GW) • PV Platform objective 2030: 200 GW • Solar electricity: SOLAR THERMAL POWER • Market size 2010: 600 MW • Market size 2020: 2400 MW • Solar Heating and Cooling • White Paper objective 2010: 100 Mm2 ~ 70 GW • ESTIF target 2020: 200GW ~300 Mm2 *COM(97)599 final Energy for the future; §ESTIA 2005 Directorate-General for Energy and Transport
SOLAR: Contribution to Policy • Phovoltaic & Solar Thermal Power to contribute RES-E Directives (2001/77/EC) • RES-Heating and Cooling Document by the end of the year • Export potential and market opening in North Africa and other neighbour countries Directorate-General for Energy and Transport
WIND ENERGY Directorate general for Energy and Transport Information - Communication
Europe’s Wind Resource • Richest resource in the world • Sufficient to provide all of EU’s electricity requirements • Technically efficient and commercial competitive to exploit • Predictable fuel cost • Independent of external political influences: very local • Clean
Wind Energy in Europe • Global wind power capacity has grown to over 50,000MW by mid-2005. Europe represents 73% of total installed capacity. • In 2004, European companies had a market share of 80% of the € 8 billion market for wind turbines. Directorate general for Energy and Transport Information - Communication
Europe as Wind Energy world leader • Europe has : • 80% global manufacturing share • 70% annual and cumulative market • Annual market value of ~ € 7bn • 72% capacity in 2 countries • 75,000 jobs • Generates 2.8% EU electricity • By 2010 wind is predicted to; • Annual electricity generation of 167 TWh, equivalent to 5.5% of European electricity demand, (=34m people) • 28% of all new installed generation capacity • 10.6% of overall generation capacity • Deliver 50% of the Renewable Directive target • Meet >30% of the EU Kyoto Protocol commitment • Cumulative CO2 savings of 523m • :Avoid €13 billion imported fuel costs, • Avoid €10-25 billion external costs • Data for 2001-2010 WIND POWER INSTALLED IN EUROPE BY END OF 2005 (CUMULATIVE) EU – 40,504 MWACCESSION COUNTRIES – 28 MWEFTA COUNTRIES – 279 MW Finland82 Sweden500 Norway267 Iceland0 Estonia30 Faroe Islands 4 Latvia26 Rep. Of Ireland495.5 Denmark3,122 Lithuania7 UK1,353 Netherlands1,219 Germany18,428 Poland73 Belgium167 Luxembourg35 Czech Republic26 Ukraine82 Slovakia5 Switzerland11.6 Austria819 Hungary17 France757 Romania1.4 Croatia6 Portugal1,022 Spain10,027 Slovenia 0 Bulgaria1 Italy1,717 Turkey20 Greece573 Cyprus0 Malta0 Source: EWEA Note: Due to previous-year adjustments, project decomissioning of 50 MW, and rounding, the 2005 end-of-year cumulative capacity total does not exactly match the year-end 2004 total plus the 2005 additions.
European Wind Energy today EU CAPACITY (MW) ACCESSION COUNTRIES (MW) EFTA COUNTRIES (MW) OTHER COUNTRIES (MW) Source: EWEA
CHALLENGES IN WIND ENERGY • Growing markets:Larger machines for optimal exploitation of the wind potential. High penetration levels of wind require short-term production forecasts • Emerging markets:Off-shore Large machines with highest reliability to reduce infrastructure and maintenance costs. Cost effective foundations and grid-connection. • New Member States: Setting-up of an industry and a support infrastructure, creating confidence, develop framework conditions Directorate general for Energy and Transport Information - Communication
BIOMASS Directorate General for Energy and Transport
Europe’s ambitious targets for bioenergy EU25, 1990-2002, biomass & waste only Targets for 2010 (EU-25):+62 mtoe for heat/electricity +18 mtoe biofuels Wood : 85 % Source: EUROSTAT Directorate General for Energy and Transport
EU Forest - Woodresources • In EU 25 : • 140 Mha forest (36 % of land) • Current level of felling : 60 % of trees • Annual forest extension : 340. 000 ha • 12 M Forest owners; • 4 M people employed (direct/ indirect) • Various studies evaluating the potential of wood/ forest • All express same main result : tremendous potential unexploited • Most recent study : EEA report ‘How much bioenergy can Europe produce without harming the environment? Directorate General for Energy and Transport
EU Forest - WoodResults of EEA report • Main findings/ conservative figures as calculated at 35€/barrel: • By 2010 : • Forest residues : 15 Mtoe • Wood waste from processing industries & demolition wood: 34 Mtoe • Complementary fellings stem wood &residues : 28 Mtoe • By 2030: • Complementary fellings stem wood &residues: 23 Mtoe • Forest residues: 16.5 Mtoe • Wood waste from processing industries & demolition wood : 37 Mtoe • If calculate at 50 €/ barrel of oil : would expect a doubling of these figures • Considerable potential for felling in many EU countries: but most important in: central EU, Italy, France, UK, Spain. Directorate General for Energy and Transport
BIOMASS ACTION PLAN MAIN COMPONENTS Current use and future potential, land availability, food & other industrial needs Functioning solid biofuels European market including international trade Power + 35 Mtoe/a by 2010 Heat/ Cooling +27 Mtoe/a by 2010 Trans-port +18 Mtoe/a by 2010 Total: + 80 Mtoe by 2010 Socio-economic issues and proper approach to the EU citizen Strategic research agenda FP7 Directorate General for Energy and Transport
Biomass Action Plan outputs COM 2005 – 628 Final • In total more than 30 specific measures proposed to stimulate the Bioenergy market and distributed under five areas ( Details in Annex 1) : • - Biomass Heating • - Biomass for Electricity generation • - Transport Biofuels • - Cross cutting issues • - Research Directorate General for Energy and Transport
Ocean Energy Technology 27 Directorate-General for Energy and Transport
Ocean Energy the associated break through promoted • Over 11000 patents worldwide • No standardisation or prevailing design 28 Directorate-General for Energy and Transport
Europe as Wind Energy world leader • Europe has : • 80% global manufacturing share • 70% annual and cumulative market • Annual market value of ~ € 7bn • 72% capacity in 2 countries • 75,000 jobs • Generates 2.8% EU electricity • By 2010 wind is predicted to; • Annual electricity generation of 167 TWh, equivalent to 5.5% of European electricity demand, (=34m people) • 28% of all new installed generation capacity • 10.6% of overall generation capacity • Deliver 50% of the Renewable Directive target • Meet >30% of the EU Kyoto Protocol commitment • Cumulative CO2 savings of 523m • :Avoid €13 billion imported fuel costs, • Avoid €10-25 billion external costs • Data for 2001-2010 WIND POWER INSTALLED IN EUROPE BY END OF 2005 (CUMULATIVE) EU – 40,504 MWACCESSION COUNTRIES – 28 MWEFTA COUNTRIES – 279 MW Finland82 Sweden500 Norway267 Iceland0 Estonia30 Faroe Islands 4 Latvia26 Rep. Of Ireland495.5 Denmark3,122 Lithuania7 UK1,353 Netherlands1,219 Germany18,428 Poland73 Belgium167 Luxembourg35 Czech Republic26 Ukraine82 Slovakia5 Switzerland11.6 Austria819 Hungary17 France757 Romania1.4 Croatia6 Portugal1,022 Spain10,027 Slovenia 0 Bulgaria1 Italy1,717 Turkey20 Greece573 Cyprus0 Malta0 Source: EWEA Note: Due to previous-year adjustments, project decomissioning of 50 MW, and rounding, the 2005 end-of-year cumulative capacity total does not exactly match the year-end 2004 total plus the 2005 additions.
Ocean Energy Costs • Dynamic, fast developing sector • Actual projected production cost bellow 0.10 €/kWh • Average electricity production cost in EU 0.04€/kWh • Target Cost by 2015-2020 0.05 €/kWh 30
Ocean EnergyFunding and priorities • EC funding the last 15 years (DG RTD) > 30M€ • 6 demo projects under negotiation in DG TREN (budget 10M€) • Priorities for FP7 • Basic Research as well as demonstration of full scale systems for electricity generation, in view of their commercial exploitation 31
ECOBUILDINGS Directorate-General for Energy and Transport
Potential for Ecobuildings in Europe • More than 40% of the final energy consumption • Since 1990 energy consumption in the domestic and tertiary sectors increased 1.3% per year • A potential of 22% energy saving could be realised in heating, cooling and lighting • A balanced share between new and retrofitted buildings • Rehabilitation necessary for 80 to 90% of buildings in the last EUR 10 • Building stocks: Between 50 and 100 mio apartments Directorate-General for Energy and Transport
ECOBUILDINGSContribution to the political and legislative objectives • Improve substantially the energy performance of the building market at a large scale transferring scientific knowledge issued from projects into stricter standards • Go beyond the requirements of existing legislation and thus contributing to a further development of regulatory issues in this sector Directorate-General for Energy and Transport
POLYGENERATION Directorate General for Energy and Transport Directorate-General for Energy and Transport
Polygeneration…beyond CHP Potential of the Sector Polygeneration applies to all energy sectors and types of fuels. Aims to maximise energy efficiency and use of resources by providing flexibility and multiple services. Principle of generating more than two energy types, CHCP, CHP&Products. Its potential for the EU is very significant. It addresses fossil fuels too. Microturbine Volvo engine adapted for DME Directorate General for Energy and Transport Directorate-General for Energy and Transport
CONCERTO WHAT IS supports concrete initiatives of local communities working towards a completely integrated energy policy, harmonizing a substantial use of RES with efficient innovative technologiesand systems to minimize energy consumption and to improve the quality of citizens’ lives. CONCERTO 37
CONCERTO Big industry Smallindustry SMEs Green electricity PV plant Storage Electricity Individual house ESCO Neighbourhood CHP Local CHP plant House with Solar thermal and PV Storage Office buildings Natural Gas Wind power plant n° 38 Directorate General for Energy and Transport Directorate-General for Energy and Transport
Citizens: From passive consumers …… to active savers Legislation is global Act locally Integration of Instruments: - from EU - from MS Think globally NETWORKING Community added value Society PROGRAMMES ManagEnergy Governance Managenergy and others Citizens: real actors n° 39 Directorate-General for Energy and Transport