Download
1 / 7
100 likes | 313 Vues
Control Charts for Variables Chapter 6. Les Jones IET 603. Chapter Summary. Shewhart Control Charts for: characteristics such as: length, width, temperature and volume. U nderstand the statistical basis of Shewhart control charts for variables

E N D
Control Charts for VariablesChapter 6 Les Jones IET 603
Chapter Summary • Shewhart Control Charts for: characteristics such as: length, width, temperature and volume. • Understand the statistical basis of Shewhart control charts for variables 2. Know how to design variables control charts 3. Know how to set up and use and R control charts 4. Know how to estimate process capability from the control chart information 5. Know how to interpret patterns on and R control charts 6. Know how to set up and use and s or s2 control charts 7. Know how to set up and use control charts for individual measurements 8. Understand the importance of the normality assumption for individuals control charts and know how to check this assumption 9. Understand the rational subgroup concept for variables control charts 10. Determine the average run length for variables control charts
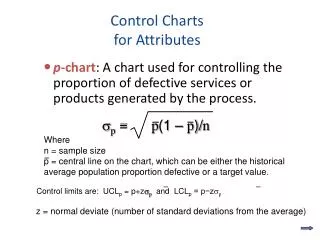
Setting Control Limits on the X Chart • Control of the process average or mean quality level is usually done with the control chart for means, or the xcontrol chart. • Process variability can be monitored with either a control chart for the standard deviation, called the s control chart, or a control chart for the range, called an R control chart. • The X and R (or s) charts are among the most important and useful on-line statistical process monitoring and control techniques. (pg. 227).
For x-Charts when we don’t know s Upper control limit (UCL) = x + A2R Lower control limit (LCL) = x - A2R where R = average range of the samples A2 = control chart factor found in Table S6.1 x = mean of the sample means Slide from: Pearson Publishers Setting Limits hilo.hawaii.edu/uhh/faculty/.../361ChapterS.ppt
Upper control limit (UCLR) = D4R Lower control limit (LCLR) = D3R where R = average range of the samples D3 and D4 = control chart factors from Table S6.1 R Limits For R-Charts Slide from Pearson Publishers at: hilo.hawaii.edu/uhh/faculty/.../361ChapterS.ppt
(a) These sampling distributions result in the charts below (Sampling mean is shifting upward but range is consistent) UCL (x-chart detects shift in central tendency) x-chart LCL UCL (R-chart does not detect change in mean) R-chart LCL Mean and Range Figure S6.5 Slide from Pearson Publishers at: hilo.hawaii.edu/uhh/faculty/.../361ChapterS.ppt