Download
1 / 19
190 likes | 338 Vues
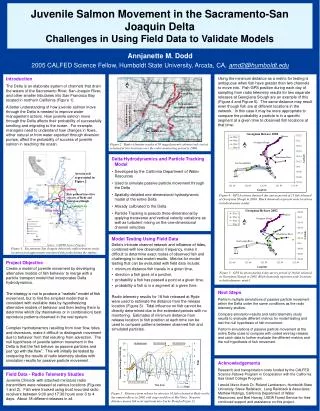
Comparing Futures for the Sacramento-San Joaquin Delta. Engineers: Jay Lund, UC Davis* William Fleenor, UC Davis Economists: Ellen Hanak, PPIC* Richard Howitt, UC Davis Biologists: Peter Moyle, UC Davis William Bennett, UC Davis Geologist: Jeffrey Mount, UC Davis *Lead authors.

E N D
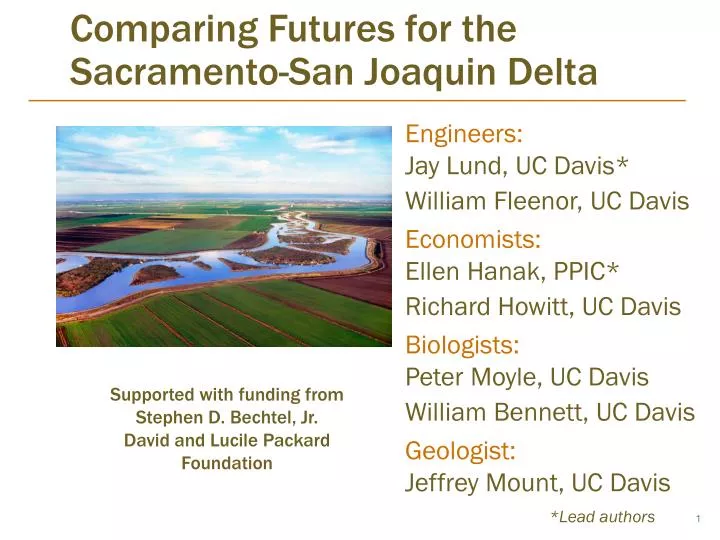
Comparing Futures for the Sacramento-San Joaquin Delta Engineers: Jay Lund, UC Davis* William Fleenor, UC Davis Economists: Ellen Hanak, PPIC* Richard Howitt, UC Davis Biologists: Peter Moyle, UC Davis William Bennett, UC Davis Geologist: Jeffrey Mount, UC Davis *Lead authors Supported with funding fromStephen D. Bechtel, Jr.David and Lucile Packard Foundation
Problems of California’s Sacramento-San Joaquin Delta • Physical instability • Land subsidence • Sea level rise • Floods • Future earthquakes • Ecosystem instability • Invasive species • Habitat alteration • Prohibitive costs for maintaining all islands • Worsening water quality for agric. & urban users
Delta of Tomorrow Will be Different • Large bodies of open water and higher sea level • Increased salinity, habitat variability • Higher water quality costs – even if all islands remain intact Based on economic value of land and assets, many islands not worth repairing after flooding (blue)
Comparing Water Export Strategies Long-Term (to Mid-Century) • Current Strategy: through the Delta • Peripheral Canal: around the Delta • Dual Conveyance: both through and around the Delta • No Exports:use other water sources and use less
Evaluation Criteria: “Co-Equal” Goals • Delta ecosystem • Delta Vision: “sustainable environment” • Our report: viability of native fish populations • Expert judgment • Water supply • Delta Vision: “reliable water supply” • Our report: statewide economic costs • Construction & operations, water quality, supply cutbacks • Use ranges to capture uncertainty
Through-Delta Pumping: Low Chance of Restoring Fish, High Costs Delta smelt 100 80 60 Likelihood of Fish Viability (%) 40 20 Through-DeltaExports 0 0.5 1 1.5 2 2.5 3 Economic Cost ($Billions/year)
Ending Exports: Better for Fish, But Even More Costly Delta smelt 100 80 60 Likelihood of Fish Viability (%) No Exports 40 20 Through-DeltaExports 0 0.5 1 1.5 2 2.5 3 Economic Cost ($Billions/year)
Peripheral Canal: Mid-range for Fish Viability, Least Costly Delta smelt 100 80 60 Likelihood of Fish Viability (%) No Exports 40 Peripheral Canal Through-Delta Exports 20 0 0.5 1 1.5 2 2.5 3 Economic Cost ($Billions/year)
Dual Conveyance: Similar to PC for Fish, Probably More Costly Delta smelt 100 80 60 Dual Conveyance Likelihood of Fish Viability (%) No Exports 40 Peripheral Canal Through-Delta Exports 20 0 0.5 1 1.5 2 2.5 3 Economic Cost ($Billions/year)
Similar Ranking for Chinook Salmon Chinook salmon 100 80 Dual Conveyance No Exports 60 Likelihood of Fish Viability (%) Peripheral Canal 40 Through-Delta Exports 20 0 0.5 1 1.5 2 2.5 3 Economic Cost ($Billions/year)
Is there a better tradeoff? Delta smelt 100 80 60 Likelihood of Fish Viability (%) Peripheral Canal++? No Exports 40 Peripheral Canal Through-Delta Exports 20 0 0.5 1 1.5 2 2.5 3 Economic Cost ($Billions/year)
Conclusions • No perfect solutions. • Delta inevitably more saline with more open water, for any water export strategy. • Changes harm water users, but likely better for fish – especially with export pumping removed. • Peripheral canal seems best for “co-equal” fish and water supply. No exports best for fish alone. • Don’t rely on Delta levees to protect water supply. • These conclusions are more robust than we expected.
Build a Peripheral Canal for Economic, Environmental Goals • Export users commit up front to pay for facilities • Export water users and upstream diverters contribute funds/water for ecosystem • Water quality savings from a canal • Expand PC diversions with fish conditions • Do not arbitrarily limit canal size • Better environmental operations • Use governance & ownership safeguards • Use PC benefits to help fund environment
Prepare for a Changing Delta Ecosystem • Habitat plans for • Climate change • Sea level rise • Permanent levee failures • New invasive species • Favor diverse habitat and flow for multiple species • Plan to make mistakes; they will happen. • Experimentation and detailed modeling needed • Include flooding at least one island
Develop a New Framework for Delta Governance and Regulation • Build a more centralized, decision-capable system • Stakeholders cannot negotiate solution alone • State leadership (governor and legislature) is required • Prepare for regulatory consequences of sea level rise, climate warming, and island failures now
For More Information • Research Brief, main report, technical appendices, animations, and spreadsheets available at: www.ppic.org