Download
1 / 33
330 likes | 400 Vues
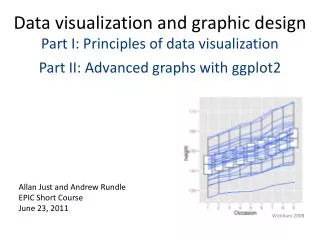
Data Visualization and Graphic Design Andrew Rundle, Dr.P.H . Allan Just, M.Phil. Goals for Today. Learn how to incorporate photos into PowerPoint. Often done sub-optimally, without an appreciation of the limitations and options. Learn how to set-up animations. Image Resolution.

E N D
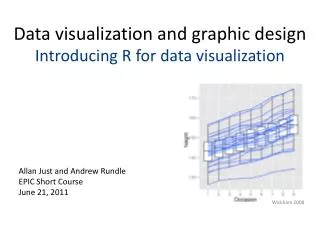
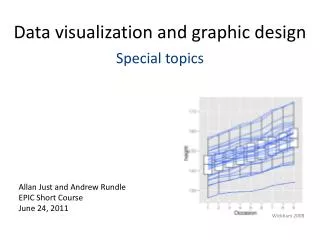
Data Visualization and Graphic Design Andrew Rundle, Dr.P.H. Allan Just, M.Phil.
Goals for Today • Learn how to incorporate photos into PowerPoint. • Often done sub-optimally, without an appreciation of the limitations and options. • Learn how to set-up animations.
Image Resolution • Screen Resolution: • VGA – 640 x 480 • DVD – 720 x 480 • HD1080 – 1,920 x 1,080 • Typical computer monitor - 1,024 x 768 to HD1080. • Camera Resolution: • 3 MegaPixel – 2,048 x 1,536 • 4 MegaPixel – 2,272 x 1,704 • 5 MegaPixel – 2,560 x 1,920
Image Resolution • Images from digital cameras are too high a resolution and make your PPT file large. • Images can be cropped in PowerPoint but the file size remains the same. • Images can be scaled in PowerPoint but the rendering can be poor and the file size remains the same. • Best to scale and crop images in GIMP and apply JPG compression.
Working with Image Files There are two ways to bring an raster file into PowerPoint. Insert Image Insert Shape Fill with image
Inserting Image Files • Insert Image • Advantages: • Easier to control scale • Access to crop tool • Access to the transparent color tool • More flexibility on the re-color tool • Pre-set transforms
Inserting Image Files • Insert Shape Fill with image • Advantages: • Can tile the image • Can make the entire image partially transparent • Can make custom transforms and distortions
Anti-Aliasing • A technique to make edges appear smooth in raster images. • Not an issue for vector graphics.
Set Transparency: Anti-Aliasing and Color Based Selection Effects
BANKY I'm secure with what I do. COLLECTOR Then say it - you're a tracer. BANKY I'm secure with what I do. COLLECTOR Then say it - you're a tracer. BANKY - I'm secure with what I do. COLLECTOR - Then say it - you're a tracer. Chasing Amy
Cleaning up Bad Scans/PDFs Men Women
Animation Tools • Entrance • Emphasis • Exit • Motion Paths
Subsequent Case Series An often cited strength of the case-cohort design is that the sub-cohort can be re-used as a referent group for future case series. Cohort Follow-up Sub-cohort Case-cohort analyses 1 short latency disease Case-cohort analyses 2, long latency disease But for case-cohort analyses 2 all the case samples will be analyzed years after the samples from the sub-cohort were analyzed. Assuring batch effects and differences in storage duration.
The Animation Stack Case-cohort analyses 1 short latency disease Case-cohort analyses 2, long latency disease
Subsequent Case Series An often cited strength of the case-cohort design is that the sub-cohort can be re-used as a referent group for future case series. Cohort Follow-up Sub-cohort Case-cohort analyses 1 short latency disease Case-cohort analyses 2, long latency disease But for case-cohort analyses 2 all the case samples will be analyzed years after the samples from the sub-cohort were analyzed. Assuring batch effects and differences in storage duration.