Download
1 / 19
190 likes | 284 Vues
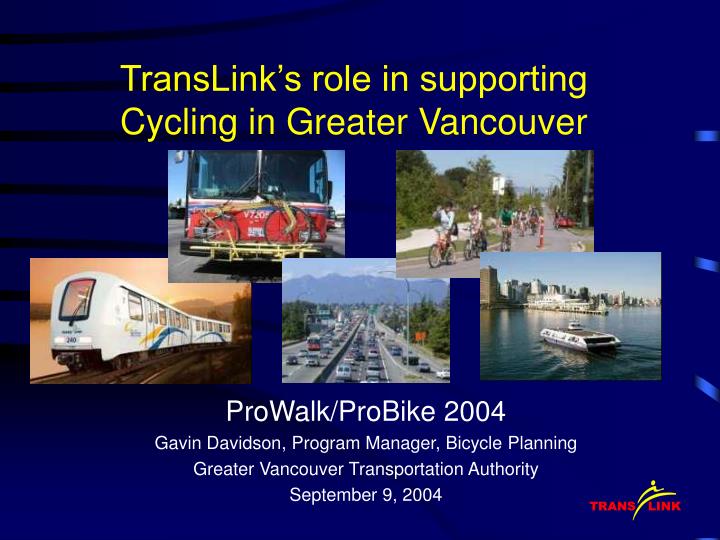
TransLink’s role in supporting Cycling in Greater Vancouver. ProWalk/ProBike 2004 Gavin Davidson, Program Manager, Bicycle Planning Greater Vancouver Transportation Authority September 9, 2004. Overview. TransLink and the GVRD Expenditure on cycling Programs

E N D
TransLink’s role in supporting Cycling in Greater Vancouver ProWalk/ProBike 2004 Gavin Davidson, Program Manager, Bicycle Planning Greater Vancouver Transportation Authority September 9, 2004
Overview • TransLink and the GVRD • Expenditure on cycling • Programs • Bicycling Infrastructure Capital Cost Sharing • TransLink owned infrastructure • Integration with Transit • Information and Marketing • Impact of improvements
Greater Vancouver Region • 21 cities in regional federation • 2.2 million residents, 3.0 million by 2031 • Rapid growth in walking and cycling • Significant transit usage • Growing congestion • Pressure to expand transportation infrastructure
TransLink: Responsibilities • Created in 1999 • Unique in Canada • Integrated approach to: • Transit • Roads • TDM • Air Quality • Funding from Transportation Sources
Transportation – Fast Facts • Approximately 6 million person trips/day • 11% by transit • 12% by walk • 2% by bicycle • Balance by motorized vehicles
Cycling program Goal Increase use of bicycle as mode of transport Strategies • Improve safety through design • Prioritise infrastructure • Understand bicycle commuters and support programs that motivate people • Build cycling facilities • Leverage investment
Cycling Expenditures • Currently 2600 lane KMs of bike routes in region • Increasing investment planned • TransLink’s commitment • 5% of road capital budget for cycling • Over 1% of roads operating budget for cycling
Bicycle Infrastructure Capital Cost Sharing • Pays for construction of bike routes across the region • 50% cost sharing with municipalities • Accelerates planned improvements • 2/3 for Municipal projects 1/3 for regionally significant projects • 2005 to 2007 • $13.45 million will leverage $16.37 million • Total investment $29.82 million • Approximately 150 KM of bike routes to be added
TransLink owned infrastructure • Knight & Pattullo Bridges and BC Parkway • Improvements in safety and continuity needed • Over $1.5 million to be spent by 2008
Integration with Transit Buses, SkyTrain, SeaBus, West Coast Express • Buses • 75% with racks • 100% by 2007 • Where transit priority exists travel times competitive w/ car
Bikes on SkyTrain • Permitted outside of rush hours • Estimated 300,000 in first year (0.5% of all riders) • Review of regulations planned
Lockers and Racks • Lockers • 340 at SkyTrain stations and park & ride lots • 50% rented • Increased promotion needed • Racks • Over 700 spaces at SkyTrain/park & ride lots • Advertising pays for racks • Expansion planned
SeaBus and WCE Bikes permitted at all times
Promotion - Education - Research Goals • Increase mode share, improve safety Strategies • Encourage • Examine • Educate • Advertise
Impact of improvements • Comprehensive data unavailable • Counts in 1995 & 2001 suggests cycling on rise • Pender (est. 2000) 100% increase • Heather (est. 1996) 200% increase • Evidence from UBC 1997-2004 • UPASS • Cycling improvements • 1999 University Boulevard Bike Lanes • Bike Racks • Bike stencils and paths • Showers, change rooms and lockers
UBC Cycling Mode Share 1997-2004 • Volume up from 2,700 (fall) to 3,200 (summer) • Mode share up from 2.5% to 3.5%