Download
1 / 14
140 likes | 189 Vues
<?xml version="1.0"?><AllQuestions />. <?xml version="1.0"?><AllResponses />.

E N D
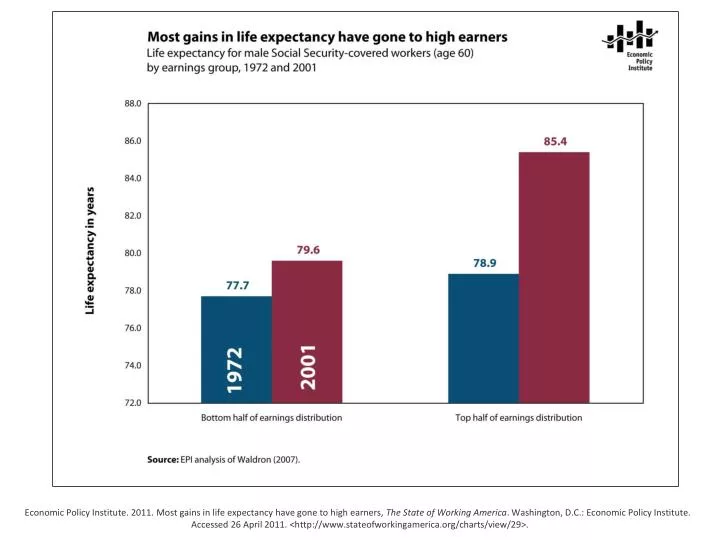
<?xml version="1.0"?><AllQuestions /> <?xml version="1.0"?><AllResponses /> <?xml version="1.0"?><Settings><answerBulletFormat>Numeric</answerBulletFormat><answerNowAutoInsert>No</answerNowAutoInsert><answerNowStyle>Explosion</answerNowStyle><answerNowText>Answer Now</answerNowText><chartColors>Use PowerPoint Color Scheme</chartColors><chartType>Horizontal</chartType><correctAnswerIndicator>Checkmark</correctAnswerIndicator><countdownAutoInsert>No</countdownAutoInsert><countdownSeconds>10</countdownSeconds><countdownSound>TicToc.wav</countdownSound><countdownStyle>Box</countdownStyle><gridAutoInsert>No</gridAutoInsert><gridFillStyle>Answered</gridFillStyle><gridFillColor>255,255,0</gridFillColor><gridOpacity>50%</gridOpacity><gridTextStyle>Keypad #</gridTextStyle><inputSource>Response Devices</inputSource><multipleResponseDivisor># of Responses</multipleResponseDivisor><participantsLeaderBoard>5</participantsLeaderBoard><percentageDecimalPlaces>0</percentageDecimalPlaces><responseCounterAutoInsert>No</responseCounterAutoInsert><responseCounterStyle>Oval</responseCounterStyle><responseCounterDisplayValue># of Votes Received</responseCounterDisplayValue><insertObjectUsingColor>Red</insertObjectUsingColor><showResults>Yes</showResults><teamColors>Use PowerPoint Color Scheme</teamColors><teamIdentificationType>None</teamIdentificationType><teamScoringType>Voting pads only</teamScoringType><teamScoringDecimalPlaces>1</teamScoringDecimalPlaces><teamIdentificationItem></teamIdentificationItem><teamsLeaderBoard>5</teamsLeaderBoard><teamName1></teamName1><teamName2></teamName2><teamName3></teamName3><teamName4></teamName4><teamName5></teamName5><teamName6></teamName6><teamName7></teamName7><teamName8></teamName8><teamName9></teamName9><teamName10></teamName10><showControlBar>All Slides</showControlBar><defaultCorrectPointValue>0</defaultCorrectPointValue><defaultIncorrectPointValue>0</defaultIncorrectPointValue><chartColor1>187,224,227</chartColor1><chartColor2>51,51,153</chartColor2><chartColor3>0,153,153</chartColor3><chartColor4>153,204,0</chartColor4><chartColor5>128,128,128</chartColor5><chartColor6>0,0,0</chartColor6><chartColor7>0,102,204</chartColor7><chartColor8>204,204,255</chartColor8><chartColor9>255,0,0</chartColor9><chartColor10>255,255,0</chartColor10><teamColor1>187,224,227</teamColor1><teamColor2>51,51,153</teamColor2><teamColor3>0,153,153</teamColor3><teamColor4>153,204,0</teamColor4><teamColor5>128,128,128</teamColor5><teamColor6>0,0,0</teamColor6><teamColor7>0,102,204</teamColor7><teamColor8>204,204,255</teamColor8><teamColor9>255,0,0</teamColor9><teamColor10>255,255,0</teamColor10><displayAnswerImagesDuringVote>Yes</displayAnswerImagesDuringVote><displayAnswerImagesWithResponses>Yes</displayAnswerImagesWithResponses><displayAnswerTextDuringVote>Yes</displayAnswerTextDuringVote><displayAnswerTextWithResponses>Yes</displayAnswerTextWithResponses><questionSlideID></questionSlideID><controlBarState>Expanded</controlBarState><isGridColorKnownColor>True</isGridColorKnownColor><gridColorName>Yellow</gridColorName></Settings> <?xml version="1.0"?><AllAnswers /> Economic Policy Institute. 2011. Most gains in life expectancy have gone to high earners, The State of Working America. Washington, D.C.: Economic Policy Institute. Accessed 26 April 2011. <http://www.stateofworkingamerica.org/charts/view/29>.
Economic Policy Institute. 2011. Wealth skewed towards the richest of the rich, The State of Working America. Washington, D.C.: Economic Policy Institute. Accessed 26 April 2011. <http://www.stateofworkingamerica.org/charts/view/22>.
Economic Policy Institute. 2011. Household wealth declines over the Great Recession, The State of Working America. Washington, D.C.: Economic Policy Institute. Accessed 26 April 2011. <http://www.stateofworkingamerica.org/charts/view/31>.
Economic Policy Institute. 2011. Where did the growth go? Share of pre-tax income growth, 1979-2007, The State of Working America. Washington, D.C.: Economic Policy Institute. Accessed 26 April 2011. <http://www.stateofworkingamerica.org/charts/view/82>.
Economic Policy Institute. 2011. Ratio of family income of top 5% to lowest 20%, 1947-2009, The State of Working America. Washington, D.C.: Economic Policy Institute. Accessed 26 April 2011. <http://www.stateofworkingamerica.org/charts/view/148>.
Economic Policy Institute. 2011. The rich are growing, while the bottom half loses ground, The State of Working America. Washington, D.C.: Economic Policy Institute. Accessed 26 April 2011. <http://www.stateofworkingamerica.org/charts/view/187>.
Economic Policy Institute. 2011. Minorities are more likely to be low-wage earners, The State of Working America. Washington, D.C.: Economic Policy Institute. Accessed 26 April 2011. <http://www.stateofworkingamerica.org/charts/view/235>.
Economic Policy Institute. 2011. Poverty rates higher among young children, The State of Working America. Washington, D.C.: Economic Policy Institute. Accessed 26 April 2011. <http://www.stateofworkingamerica.org/charts/view/180>.
Economic Policy Institute. 2011. Incomes matter more than test scores for college completion, The State of Working America. Washington, D.C.: Economic Policy Institute. Accessed 26 April 2011. <http://www.stateofworkingamerica.org/charts/view/224>.
Economic Policy Institute. 2011 Top universities still mostly the preserve of the better-off, The State of Working America. Washington, D.C.: Economic Policy Institute. Accessed 26 April 2011. <http://www.stateofworkingamerica.org/charts/view/232>.
Economic Policy Institute. 2011 Harder for sons born in the bottom quintile to reach middle class in the United States, The State of Working America. Washington, D.C.: Economic Policy Institute. Accessed 26 April 2011. <http://www.stateofworkingamerica.org/charts/view/223>.
Economic Policy Institute. 2011 Wide disparities in infant mortality persist by race, The State of Working America. Washington, D.C.: Economic Policy Institute. Accessed 26 April 2011. <http://www.stateofworkingamerica.org/charts/view/97>.
Economic Policy Institute. 2011 United States spends more than any other country on health care, The State of Working America. Washington, D.C.: Economic Policy Institute. Accessed 26 April 2011. <http://www.stateofworkingamerica.org/charts/view/108>.
Economic Policy Institute. 2011 Declining unionization, The State of Working America. Washington, D.C.: Economic Policy Institute. Accessed 26 April 2011. <http://www.stateofworkingamerica.org/charts/view/204>.