Download
1 / 23
230 likes | 395 Vues
Intro to Water Quality Modeling: Estimating Pollutant Load Reductions for Project Reporting. Scott Daly Utah Division of Water Quality 801.536.4333 sdaly@utah.gov. Objective. UAFRRI – Utah Animal Feedlot Runoff Risk Index Overview Data Inputs Load Reductions/Risk Assessment

E N D
Intro to Water Quality Modeling:Estimating Pollutant Load Reductions for Project Reporting Scott DalyUtah Division of Water Quality801.536.4333sdaly@utah.gov
Objective • UAFRRI – Utah Animal Feedlot Runoff Risk Index • Overview • Data Inputs • Load Reductions/Risk Assessment • STEPL – Spreadsheet Tool for Estimating Pollutant Loads • Overview • Data Inputs • Model Setup • Load Reduction • Limitations • Data Sources • WQ Models and Project Planning
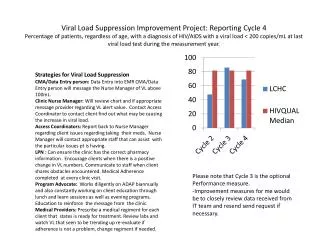
Utah Animal Feedlot Runoff Risk Index (UAFRRI) • MS Excel spreadsheet • Inputs – physical and management characteristics • Output - Nutrient loading and load reduction estimates (N, P, and BOD5); Feedlot Risk Assessment
Spreadsheet Tool for Estimating Pollutant Loads(STEPL) • MS Excel spreadsheet • Easy to use • Inputs can be modified by user (optional) • Calculates nutrient (N, P, and BOD5) and sediment loads by land use type • Calculates expected load reductions • Data driven and highly empirical
STEPL Process Processes Load User Input Land Uses Runoff BMPs/LIDs Nitrogen Animals Groundwater Sheet/Rill Erosion Phosphorus • Precipitation • Irrigation Load Reduction BOD Soil and USLE Parameters Gully/ Streambank Erosion Sediment • Septic Systems • Direct Discharges Pollutant Transport
STEPL Web Site Link to download http://it.tetratech-ffx.com/steplweb/
STEPL Main Program • Run STEPL executable program (STEPL.exe) • Start All Programs STEPL
STEPL Spreadsheet Composed of four worksheets
Add New Data to BMP List • In STEPL customized menu, click “View/Edit BMP List” • BMP List worksheet is shown, add or delete BMPs
Add New Data to BMP List Update BMP button (BMPList worksheet) • Click “Update BMP Data” button to update the BMP selections in the BMPs worksheet • Click “Save Updates” to save changes to text files (comma delimited) • C:or D:\Stepl\Support\AllBMPstepl.csv • C: or D:\Stepl\Support\AllBMP.csv New BMP added! (BMPs worksheet) New BMP added!
STEPL BMP Calculator • Calculates combined efficiency of a BMP train for a given land use.
Series Reduced tillage Parallel Conventional tillage Reduced tillage Conventional tillage Reduced tillage Filter strip Settling Basin Combination STEPL BMP Calculator Filter strip
STEPL BMP Calculator 4. Calculate combined efficiency 1. Add BMP box • Describe schematically BMP configuration • Number and linkages • BMP type and efficiency • Land use area • Calculate combined efficiency • Enter calculated efficiency in table 7 on the BMP tab 5. Delete Connection 2. Draw Connection 3. Move BMP box
Other Ways to Use STEPL • Model changes in land use and runoff before and after BMPs instead of modeling efficiencies • Estimate BMP efficiencies BMP efficiency = (Pre BMP load – Post BMP load) / Pre BMP load • Project planning • Compare two projects to determine which has the most potential for load reduction • Compare multiple BMPs within the same project area
Model Limitations • Driven by empirical relationships • Emphasis for project-specific data • Model calibration/validation • Not easy to calibrate • Designed to produce “rough” loading estimates, NOT precise loading
Table 1. Input watershed land use area (ac) and precipitation (in) • 1. Precipitation: (a). Local observation (b). http://www.wrcc.dri.edu/ • (c). http://www.wcc.nrcs.usda.gov/snow/ (d). nws.noaa.gov • Table 4. Modify the Universal Soil Loss Equation (USLE) parameters • K Factor - http://websoilsurvey.nrcs.usda.gov/app/HomePage.htm • LS Factor – Field measurements for slope length (L) and slope (S), then consult the following tables. USDA Agricultural Handbook 703: Tables 4-1 through 4-9. • Cover Management Factor – USLE Appendix A - Cover Managment Factor.doc and http://www.iwr.msu.edu/rusle/doc/cfactors.pdf • Support Practice Factor – http://www.omafra.gov.on.ca/english/engineer/facts/00-001.htm Table 5 Data Resources
Data Resources Table 5. Select average soil hydrologic group (SHG) • Soil Hydrologic Group = Hydrologic Soil Group • http://websoilsurvey.nrcs.usda.gov/app/HomePage.htm • Table 6. Reference runoff curve number (may be modified) 1. SCS Runoff Curve Number Computations.pdf, Appendix A Table 2-2