Download
1 / 13
130 likes | 221 Vues
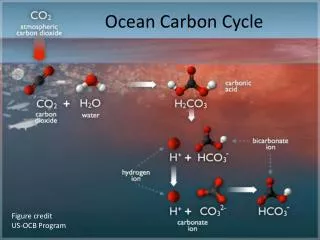
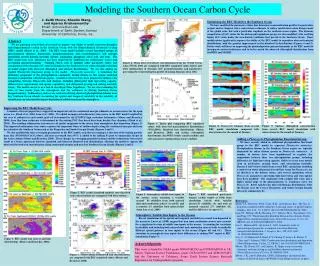
Measurements of atmospheric O 2 in relation to the ocean carbon cycle. Ralph Keeling Scripps Institution of Oceanography. The carbon cycle. Northern and Southern CO 2 records. Where is the signal of the oceans in these data?. Mauna Loa (black) South Pole (red). CO 2 variability.

E N D
Measurements of atmospheric O2 in relation to the ocean carbon cycle Ralph Keeling Scripps Institution of Oceanography
Northern and Southern CO2 records Where is the signal of the oceans in these data? Mauna Loa (black) South Pole (red)
CO2 variability • Land biosphere dominates CO2 variability on all time scales except long term. • Advances from using inverse models of atmospheric CO2 data (e.g. CarbonTracker) are mostly limited to short-term fluxes on land. • Large uncertainties still surround long-term fluxes. • Atmospheric CO2 data alone cannot yield much new insight into ocean biogeochemistry.
F B O Ocean CO2 uptake: H2O + CO2 + CO3= ↔ 2HCO3- Atmospheric CO2 & O2 budgets ΔCO2 = F – O – B ΔO2 = -1.4F + 1.1B +Z ΔAPO = ΔO2 + 1.1ΔCO2 = -0.3F -1.1O + Z “Atmospheric Potential Oxygen” Z Z
Northern and Southern APO records • Ocean dominates APO variability on all time scale except long term. • Long-term trend in APO dominated by fossil-fuel and ocean CO2 uptake. • Shorter-term variability mostly related to air-sea O2 exchanges.
Cape Grim Trend Any trend in amplitude is less than 1% per year. No evidence of large changes over the past 2 decades.
Seasonal air-sea O2fluxes Northern Hemisphere Southern Hemisphere JUNE DECEMBER
What are we headed in ocean biogeochemistry data assimilation? • Joint ocean/atmosphere/land biosphere data assimilation • Assimilations that optimize processes controlling fluxes rather than the fluxes themselves. • Enhance ocean modeling component to assimilate changing ocean physics (e.g. Argo data, etc). • Assimilation of CO2, O2, pCO2, ocean color