Download
1 / 32
320 likes | 437 Vues
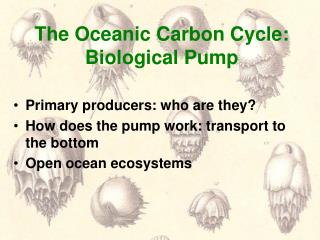
Modeling the biological component of the ocean carbon cycle. Anand Gnanadesikan Johns Hopkins University. Ocean ecosystems-The simplest picture. Biological activity takes up these nutrients. Shallow sunlit euphotic zone. Mixing and upwelling bring nutrients to the surface. High nutrient

E N D
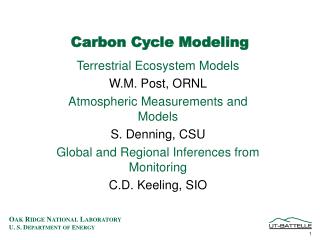
Modeling the biological component of the ocean carbon cycle Anand Gnanadesikan Johns Hopkins University
Ocean ecosystems-The simplest picture Biological activity takes up these nutrients Shallow sunlit euphotic zone Mixing and upwelling bring nutrients to the surface. High nutrient ocean interior Sinking fluxes export nutrients back to depth Nutrients include: N,P,Si,Fe
Key question • How much of the nutrient brought to the surface is taken up by biological cycling? • How much is reinjected to depth? M
Observed “efficiency” Key point- in modern ocean efficiency is low in high latitudes.
Different ways of dealing with “efficiency” • LOSCAR (last week’s paper), Constant value of 0.8. • “Volume averaged” value is closer to 50% • Changes in carbon can only be driven by changes in nutrient inventory. • “Diagnostic” models (Marinov et al., 2008) restore nutrients to a surface value- effectively fit observed levels of efficiency. • Captures relationship between volume-averaged efficiency and circulation… • But not clear what to do in past. • “Prognostic” ocean models (try to match nutrients and some measure of biological activity). • Will generally fit modern nutrients worse than a diagnostic model. • Generally requires more inputs • Equations can be debated.
What do we need to build a prognostic model • Formulation of phytoplankton growth rate • Macronutrient limitation (nitrogen, phosphorus, silicon?) • Micronutrient limitation (iron) • Light • Formulation of phytoplankton death rate. • Explicit treatment of zooplankton • Implicit treatment of zooplankton
Basic strategy • In order to get nutrients right, we need to model their uptake. • In order to get chlorophyll right we need to model the biomass accomplishing this uptake. Uptake=Growth rate*Biomass Start by looking at growth rate. Uptake~Loss rate*Biomass Close the loop by parameterizing mortality.
What are the conceptual tools we want to use to do this? • Multiple limitations (temperature, light, macronutrients, iron). Builds on theory by Richard Geider. • Allometric (size-structured) relationship between ecosystem structure and function. Builds on theory by Dunne, Armstrong, Gnanadesikan and Sarmiento.
Representing growth: 1. Temperature limitation Eppley (1972) showed that the maximum growth rate of plankton had a temperature-dependent upper limit. Note the spread! Individual species tend to be adapted for specific temperature range.
Representing growth:2. Macronutrient limitation … is balanced by rate at which free nutrient encounters open binding sites= N*(K-B) Rate at which nutrient is incorporated from binding sites to which it is attached = CB Solution has form Curve shows uptake rate (v) vs concentration Line shows nutrient concentration/uptake rate vs. nutrient concentration. Eppley, Rodgers and McCarthy, 1969
Representing growth: 3.Iron limitation • Tricky because of luxury uptake (plankton don’t stop taking up iron at concentrations above repletion). • Let uptake ratio go as Michaelis-Menten…. • But allow plankton to become replete at lower concentrations of iron.
Representing growth: 4.Light limitation Also saturates at high levels Key parameter is the slope of this curve at low light levels Tilzer et al., Polar Biology, 1986. Chlorophyll-normalized photosynthetic efficiency Chl:C ratio
Geider+ co-limitation theory Key ideas: Phytoplankton adjust their ability to harvest light to match their inherent growth rate. (Geider) Their ability to do this can be limited/affected by iron. (Dunne- TOPAZ).
Total growth rate Temperature Macro/micronutrient Light Basic formulation common to TOPAZ, CCSM, IBGC…. Key complication, light limitation depends on other variables!
But to get nutrient uptake, we need an estimate for biomass Key insight: On time scales of months, almost all of the production is balanced by loss terms. Accumulation of biomass is a small residual. Growth_rate*biomass~ Loss rate*biomass But loss rate may itself depend on the biomass concentration. Schultz, 2008
Accounting for loss rates But is there a way of coming up with l, P* and a? Answer: Calibrate them to ecosystem structure. (High productivity regions dominated by big plankton).
Dunne et al. (2005) theory Define small (S) and large (L) phytoplankton
So we are able to diagnose • Growth rates • Phytoplankton biomass • Chlorophyll concentration (from q) • Ecosystem structure (small vs. large) How do we now connect this to nutrient cycling?
Sinking a function of ecosystem structure Ecosystems dominated by small plankton (like blue-green algae at left) don’t generate a lot of sinking material Ecosystems dominated by large plankton (like diatom at left) generate a lot of sinking material
Parameter list Taken from literature unmodified (in blue) Fit to ocean chlorophyll. Fit to ocean nutrients/ DOM/ oxygen Fit to iron distribution
Additional parameters when modeling carbon • PIC:POC export ratio (from modern data) • PIC remineralization length scale (from modern alkalinity distribution). • C:P ratio (fixed from modern nutrients) • Outputs include • Export • Flux to bottom • pH/calcite saturation parameters
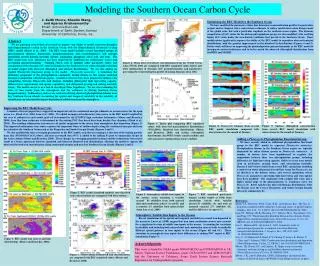
Obs PO4 BLING PO4 BLING-Obs PO4 Schneider et al., Biogeosciences 2008
Obs Chl BLING Chl
Key question asked in this paper • What’s the impact of including explicit iron limitation (spatiotemporally dependent) on phytoplankton physiology? • Does iron affect growth, photosynthetic efficiency, carbon:chl ratio, or all three?
Adding iron limitation decreases efficiency in Southern Ocean more than north
Biggest impact of iron-light colimitation on NH seasonal cycle
For applying this to future climate • Macronutrient inventory. • Set equal to today’s at first guess… • But lifetime for PO4 is only 50,000 yr • Isotope constraints? • Iron delivery to ocean • look at distribution of deserts • Iron delivery from hydrothermal vents?