Download
1 / 16
170 likes | 283 Vues
Yellowstone Fires and Their Hydrologic Effects. Patrick Sejkora November 17, 2009 GIS in Water Resources. Yellowstone National Park 1988 Fires. 1988 driest summer on record 7 major fires burned June-September 1988 3,215 km 2 (36% of park) burned 485 km 2 on August 20 alone!

E N D
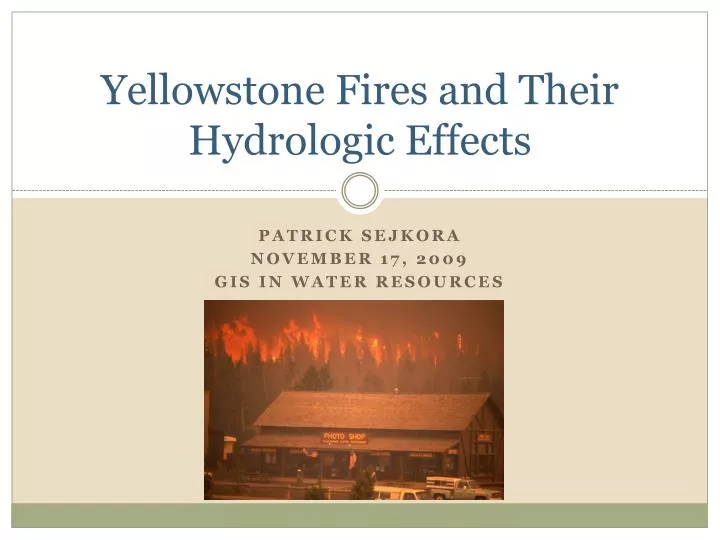
Yellowstone Fires and Their Hydrologic Effects Patrick Sejkora November 17, 2009 GIS in Water Resources
Yellowstone National Park 1988 Fires • 1988 driest summer on record • 7 major fires burned June-September 1988 • 3,215 km2 (36% of park) burned • 485 km2 on August 20 alone! • Fires extinguished in September by rain/snow
Objectives • Did fires augment surface water runoff regimes in Yellowstone? • Hypothesis: Evapotranspiration and infiltration rates decrease in burned areas1, increasing runoff • Evaluate using runoff ratio: • Is runoff ratio post-fires higher than pre-fires? 1. Robichaud 2000
GIS DATA Firehole River Park outline and Digital Elevation Map (DEM) NHD Flowlines and USGS Gage Sites Burn Type Raster Compare runoff ratios between heavily burned and unaffected (control) watersheds Before Fire After Fire Boundary Creek
Firehole River(burned/experimental watershed) Baseflow 7.37 m3/s 724 km2 watershed (obtained with ArcHydro Terrain Preprocessing) 288 km NHD flowline Drainage Density of 0.40/km 4th order stream at gage
Boundary Creek(unburned/control watershed) Baseflow 1.94 m3/s 224 km2 watershed 151 km NHD flowline Drainage Density of 0.68/km 3rd order stream at gage
Firehole River Boundary Creek
Precipitation Data Find similar precipitation events before and after 1988 fires Obtain data from National Climactic Data Center Interpolate rainfall across park via Spline
July 10, 1987 Pre-1988 Precipitation Event Average Precipitation Across Watersheds September 18, 1989 0.5 cm Spline raster can be used to estimate rainfall across watersheds Zonal Statistics Tool in Spatial Analyst 0.6 cm 1.6 cm 1.6 cm July 11, 1987 1.7 cm 1.6 cm
Storm Event Flow Conditions Firehole River Boundary Creek Pre-Fire Post-Fire
Runoff Ratios Runoff Ratio Example Calculation (Boundary Creek 9/18/1989) Firehole River Pre-Fire RR = 1.1% Post Fire RR = 0.9% Boundary Creek Pre-Fire RR = 1.1% Post Fire RR = 0.9% These Runoff Ratios aren’t very different!
Conclusions • Runoff Ratios before and after fire are indistinguishable in burned watershed • An event’s runoff ratio same for both watershed • Suggests other factors besides landcover may influence runoff regimes • Antecedent dry period, storm intensity, etc.?
Future Work • Evaluate other storm events using same methodology • NEXRAD precipitation data for recent events • Similar effects for snow melt?
Firehole River Boundary Creek
Firehole River Boundary Creek