Download
1 / 32
320 likes | 453 Vues
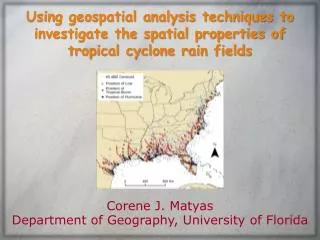
Measuring Atmospheric Changes in the Arctic. Christopher J Cox University of Idaho, Geography. Von Walden (UI), Penny Rowe (UI), Matt Shupe (UC, Boulder Mike Town (UW), Ed Eloranta (U Wisconsin) Funding by National Science Foundation (NSF) NOAA SEARCH, CANDAC, ARM, SSEC, IGRA, NSIDC.

E N D
Measuring Atmospheric Changes in the Arctic Christopher J CoxUniversity of Idaho, Geography
Von Walden (UI), Penny Rowe (UI), Matt Shupe (UC, Boulder • Mike Town (UW), Ed Eloranta (U Wisconsin) • Funding by National Science Foundation (NSF) • NOAA SEARCH, CANDAC, ARM, SSEC, IGRA, NSIDC Acknowledgments
What is climate change? • The Arctic Climate System • Instrumentation • Preliminary research • Conclusion Outline
What is Climate Change?Scientific Consensus • “Warming of the climate system is unequivocal, as is now evident from observations of increases in global average air and ocean temperatures, widespread melting of snow and ice and rising global average sea level” (WGI 3.9, SPM) • Intergovernmental Panel on Climate Change (IPCC) • Climate change no longer a scientific debate, but a societal issue
Global atmospheric concentrations of carbon dioxide, methane, and nitrous oxide (all greenhouse gases) have increased markedly as a result of human activities since 1750. What is Climate Change?The Greenhouse Effect IPCC WG1.2 Figure 1
A1Fl “Aggressive” Scenario (850 ppm) Potential Human Contribution What is Climate Change?The Greenhouse Effect A1B “Medium” Scenario (700 ppm) B1 “Green” Scenario (550 ppm) } Natural Variability
So what about Arctic? Primarily as a result of a strong ice-albedo postive feedback, the Polar Regions are very sensitive to a warming climate. But, they are also poorly quantified! What is Climate Change?The Greenhouse Effect
Previous Research • Arctic atmosphere • Surface Heat Budget of the Arctic (SHEBA) • Intrieriet al (2002) An annual cycle of Arctic surface cloud forcing at SHEBA • Shupeet al (2005) Arctic mixed-phase cloud properties from surface-based sensors at SHEBA • Other • Key et al (2004) “Cloud distributions over the coastal Arctic Ocean: surface-based and satellite observations” • Shupe & Intrieri (2003) “Cloud Radiative Forcing of the Arctic Surface: The Influence of Cloud Properties, Surface Albedo, and Solar Zenith Angle • Tjernstromet al (2004) “The Summertime Arctic Atmosphere: meteorological measurements during the Arctic Ocean Experiment 2001” • Verlindeet al (2004) “Mixed-Phase Arctic Cloud Experiment (M-PACE)” • Recent Sea Ice Melt • Drobot et al (2008) “Evolution of the 2007-2008 Arctic sea ice cover and prospects for a new record in 2008” • Kay et al (2008) “The contribution of cloud and radiation anomalies to the 2007 Arctic sea ice extent minimum” • Perovich et al (2008) “Sunlight, water,and ice: Extreme Arctic sea ice melt during the summer of 2007” • Schweiger et al (2008) “Did unusually sunny skies helpdrive the record sea ice minimum of 2007?” • Zhang et al (2008) “What drove the dramatic retreat of arctic sea ice during summer 2007?”
Downwelling Infrared • Atmospheric properties • Temperature, Humidity • Cloud properties • not well known • climate models • Upwelling Infrared • Surface prop (e, Ts) • Satellite validation The Arctic Climate System
Signs of Arctic Climate Change National Snow and Ice Data Center (NSIDC)
Instruments now in the Arctic • Polar Atmospheric Emitted Radiance Interferometer • Arctic High Spectral Resolution Lidar (AHSRL) • Ed Eloranta (SSEC. U. Wisconsin-Madison) • Millimeter Cloud Radar (MMCR) • NOAA ERL, Boulder, CO • Microwave Radiometer (MWR) - total column water vapor • NOAA ERL, Boulder, CO • Radiosondes from the Eureka Weather Office http://lidar.ssec.wisc.edu/
Instrument Specs AHSRL • Arctic High Spectral Resolution Lidar (AHSRL) • LIDAR – Light Detection and Ranging • 40 ns pulse width • Wavelength: 523 nm • http://lidar.ssec.wisc.edu/
Instrument Specs MMCR Millimeter Cloud Radar Zenith pointing radar Operates at 35 Ghz Used to determine cloud boundaries • http://arm.gov/ • http://lidar.ssec.wisc.edu/ www.arm.gov
Instrument Specs MWR Microwave Radiometer Measure microwave emission from water (liquid/vapor) Reports column integrated amounts • http://arm.gov/ • http://lidar.ssec.wisc.edu/ www.arm.gov
Instrument Specs PAERI Polar Atmos. Emitted Radiance Interferometer • Spectral infrared radiance from 3 to 20 mm (1 cm-1) • Two detectors: MCT - LW and InSb - SW • Very accurate [1% (3) of ambient radiance] • http://lidar.ssec.wisc.edu/
PAERI Cloud CO2 O3 CH4, N2O H2O
What can we use PAERI output for? • Cloud fraction • Trace gas measurements • Scale radiosondes • Validate satellites • Longwave cloud radiative forcing • more… PAERI
Instrument Sites Eureka, Nunavut, Canada: Study of Environmental Arctic Change (SEARCH) Arctic Observing Network (AON) at Canadian Network for the Detection of Arctic Change (CANDAC) site 79º59’N, 85º57’W Barrow, Alaska: Atmospheric Radiation Measurement (ARM) North Slope Alaska (NSA) site 71º18’N, 156º44’W
LongwaveDownwelling Radiation and Arctic Sea Ice Melt • Preliminary experimental evidence for the importance of downwellinglongwave radiation to the recent decrease in sea ice concentration over the Arctic Ocean. • Was shortwave downwelling radiation (SDW) the cause? • Kay et al (2008) “The contribution of cloud and radiation anomalies to the 2007 Arctic sea ice extent minimum” • Perovich et al (2008) “Sunlight, water,and ice: Extreme Arctic sea ice melt during the summer of 2007” • Was it longwavedownwelling radiation (LDW)? • Schweiger et al (2008) “Did unusually sunny skies helpdrive the record sea ice minimum of 2007?”
Calculating DLW Flux and LWCRF • AERI measurements made at zenith • Out of band radiance was simulated as a black body using brightness T from 650-660 cm-1 • Assume isotropic radiance (fluxes within ~5%) • Focusing on Eureka data only • LW CRF = All – Clear (Ramanathanet al, 1989)
Differences in DLW and CRF • LWCRF depends on many variables • FCC • Optical thickness of clouds • AND Temperature of the near-surface air (in winter)
Conclusions • The phenomenon of accelerated climate change is a scientific consensus • The Arctic is environment is very sensitive to a warming climate and is poorly quantified • Recent sea ice retreat may be signs of a changing climate system • Determining the potential causes of recent sea ice decrease in the Arctic is complicated • Experimental evidence may show that the all-sky flux has influenced sea ice retreat through an increase in the near surface temperature and/or increases in humidity
Sources • Drobot, S; Stroeve, J; Maslanik, J; Emery, W; Fowler, C, and Kay, J. 2008. “Evolution of the 2007-2008 Arctic sea ice cover and prospects for a new record in 2008”. Geophysical Research Letters. Vol. 25(L19501), 5p. • Intrieri, JM; Shupe, MD; Uttal, T; McCarty, BJ. 2002. “An annual cycle of cloud characteristics observed by radar and lidar at SHEBA” Jounal of Geohpysical Research – Oceans. Vol. 107:C10(8030). • IPCC, 2007, Climate change (2007) Synthesis Report, Summary for Policy Makers, 22p. • Kay, J; L’Ecuyer, T; Gettelman, A; Stephens, G; and O’Dell, C. 2008. “The contribution of cloud and radiation anomalies to the 2007 Arctic sea ice extent minimum”. Geophysical Research Letters. Vol. 25(L108503), 5p. • Perovich, DK; Richter-Menge, JA; Jones, KF; Light, B. 2008. “Sunlight, water, and ice: Extreme Arctic sea ice melt during the summer of 2007”. Geophysical Research Letters. Vol. 25(L11501), 4p. • Ramanathan, V; Cess, RD; Harrison, EF; Minnis, P; Barkstrom, BR; Ahmad, E; and Hartmann, D. 1989. “Cloud-Radiative Forcing and Climate: Results from the Earth Radiation Budget Experiment”. Science. Vol. 243(4887), pp 57-63. • Shupe. MD and Intrieri, JM. 2003. “Cloud Radiative Forcing of the Arctic Surface: The Influence of Cloud Properties, Surface Albedo, and Solar Zenith Angle”. Journal of Climate. Vol. 17(3), pp.616-628. • Schweiger, AJ; Zhang, J; and Steele, M. 2008. “Did unusually sunny skies help drive the record sea ice minimum of 2007?” Geophysical Research Letters. Vol. 35(L10503), 6p. • Tjernström, M; Leck, C; Ola, P; Persson, G; Jensen, ML; Oncley, SP; Targino, A. 2004. “The Summertime Arctic Atmosphere: Meteorological Measurements during the Arctic Ocean Experiment 2001”. Bulletin of the American Meteorological Society. Vol. 85(9), pp. 1305-1321. • Town, MS; Walden, VP; and Warren, S. 2005. “Spectral and Broadband LongwaveDownwellingRadiative Fluxes, Cloud Radiative Forcing, and Fractional Cloud Cover over the South Pole”. Journal of Climate. Vol. 18, pp. 4235-4252. • Zhang, J; Lindsay, R; Steele, M; and Scheiger, A. 2008. “What drove the dramatic retreat of arctic sea ice • during summer 2007?” Geophysical Research Letters. Vol. 25(L11505), 5p.