Download
1 / 30
300 likes | 400 Vues
Peak Oil, Reserves, Production and Current Events. Ray Leonard President and CEO Hyperdynamics Corporation Houston, September 2009 . “It’s not the size of the tank but the size of the tap”.

E N D
Peak Oil, Reserves, Production and Current Events Ray Leonard President and CEO Hyperdynamics Corporation Houston, September 2009
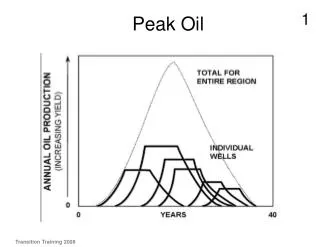
“It’s not the size of the tank but the size of the tap” • Peak Oil is dependant on the level of production. The level of production is not dependant on the level of reserves in much of the world, only the portion which operates under free market conditions, which is becoming a smaller and smaller portion of the world market.
2006 World Reserve Additions (BBO) IHS dataset (King 2006) (red: exploration growth, green: delayed reporting, yellow: reserve growth)
Reserve Growth: Exploration vs. Reservoir Optimization, and cost (Leonard 2006, Papay 2005) • Exploration reserve additions totaled approx. 240 BBO in 1981-2005 • Reserve additions from existing reservoirs added 490 BBO during same period (approx 20% from Tertiary recovery) • Extrapolating trends to future; 400-800 BBO to be added through reservoir optimization, 200-250 MMBO through exploration • Full application of Tertiary recovery to reservoirs not now undergoing EOR can add up to 200 BBO
Oil World Divided into 3 segments • OPEC: controls 73.9% of world reserves, 44.9% of present production • Former Soviet Union (FSU): controls 12.7% of world reserves, 15.6% of present production • Rest of World (ROW): controls 13.4% of reserves, 39.5% of present production
Production 3 segments (BP Statistical Review 2008, conventional oil)
Changing Proportion of World Reserves Present yearly production consumes 1.5% of OPEC reserves, 3.5% of FSU, and 7% of the rest of the world Extending this trend into the future with current reserve base increases OPEC’s reserve share to 80% by 2020 Rest of the world’s share reduces to less than 10% by 2015
OPEC • Arabian Gulf: Saudi Arabia, Kuwait, Iran, Iraq and UAE control 77% of OPEC reserves. Dramatic change in reserve numbers function of classifications (SEC vs SPE vs potential enhanced recovery). • Limitation on production level for this segment is mostly due to politics, lack of motivation, investment level and type of crude; NOT shortage of reserves • Production costs vary from low in Gulf to high in deep water West Africa and Venezuela (heavy oil)
OIIP Hyperbolic Creaming CurveSaudi Arabia (Zagar, 2005) 2000 1974
OIIP – Oil Initially In Place (Zagar, 2005) ARAMCO OIIP Growth CICS 2/04 65 Static Fields – 17% of OIIP 16 Produced Fields – 83% of OIIP 10 Producing Fields – 64% OIIP
Saudi Arabia reserve range • Production through 2008: 118 BBO • If discovered OOIP is 590 BBO, 50% RF indicates reserves of 177 BBO, 65% RF yields 265 BBO • If reserve growth to 700 BBO OOIP has taken place as claimed by Aramco, 50% RF indicates reserves of 232 BBO, 65% RF yields 337 BBO
Former Soviet Union • Russia, Kazakhstan and Azerbaijan control over 97% of reserves and production in the FSU • From 1999-2007, production from FSU increased from 7.5 MMBOD to 13 MMBOD, providing 60% of world production growth in that period • Russian reserves from author’s study 117 BBO (BP statistical review 79.8 BBO) • Russian reserves were sufficient to continue growth to 14 MMBOD by 2010, but politics and tax regime have halted growth • Kazakhstan reserves sufficient to double production to 3 MMBOD, but increase slowed down due to pipeline constraints and mismanagement of Kashagan development • Azerbaijan has no exploration success, reserves insufficient to increase beyond 1.2 MMBOD plateau from Azeri-Chirag before decrease
West Siberia (Leonard 2006) Average Field size by 100 discoveries
West Siberian Reserves and Future Potential Summary (Leonard 2006) • Original Oil in Place 429 BBO • Initial recoverable Reserves 151 BBO • Produced Reserves (through 2008) 74 BBO • Current Proved Reserves 77 BBO • New Discoveries 8.2 BBO • Optimized Secondary Recovery 37.8 BBO • Tertiary Recovery 25.7 BBO • Total Future Reserves 148.7 BBO
Challenges to maintain Russian production level • Fields in West Siberia and Volga Urals are mature and high maintenance; they need intensive technical work and capital support to avoid decline • New areas (East Siberia, offshore) are capital intensive and rely on high prices for economic viability • Because of debt level and local and international financial markets, Russian firms will have difficult access to capital unless directly from state • Russian tax system gives limited amount of return for investing in optimized recovery in mature fields • Revival in Russia (military, infrastructure, social) is so dependent upon oil revenues that significantly reducing oil tax rates will be a difficult choice
Rest of World • The Rest of World contributes 39.5% of world production from only 13.4% of reserves (not including tar sands) • Decline rate of existing fields estimated at 7% per year • With exception of Brazil (ultradeep water) major producing countries at or past peak • Rapid declines in recent years from North Sea and Mexico, USA decline temporarily halted by Deep Water GOM • Overall production peaked in 2000-2003, intensive effort is needed to minimize decline rate • New production from ultadeep development has masked decline of ROW but within next decade, this peak will pass and decline will accelerate • Most of new production, particularly Brazil and other ultradeep water dependant upon high oil prices for commerciality
Depletion and the example of Texas oil production (1859 – 2008) Peak production: 1972 3.5 million barrels/day Started in 1895-96
Unconventional Oil Production (Leonard, 2006) • Unconventional in-place resources of bitumen, tar sand and oil shale are roughly 10 trillion barrels or equivalent to initial in-place resources of conventional oil • However, compared to average recovery factor of 35% for conventional oil, the recovery of the unconventional resources will average 10% or less • The costs, monetary, manpower and environmental are considerably higher to develop these resources • Unlike conventional oil, where three most prolific basins are in eastern hemisphere, for unconventional three largest resources are in Canada, Venezuela and western United States • Due to economic, political and environmental factors, the contribution of these sources will be less than 3 MMBOD, less than half predicted amount
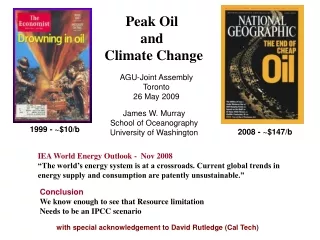
Conclusions on Peak Oil • In long term, (after current disruption) moderate rise in production by OPEC will be offset by decrease in production in Rest of World with FSU production steady • Production peak of ultadeep water fields will allow “peak” to be “plateau” in coming decade followed by sharp fall • Supply side crisis of 2005-2008 due to Peak reached in ROW in 2003 combined with cessation of significant production growth in Russia after 2004 during a period of rapid demand increase • We were nearing World Peak Oil, which resulted in high prices and associated political and economic disruptions, the consequences we are having to deal with
Long term Prognosis • World was nearing Peak Oil at 90 MMBOD and this does not change by recent events • Peak could be delayed by a number of years due to reduced demand • Rest of World Production will have more rapid decline in lower price scenario meaning that eventual peak will have larger OPEC component • Continuing climate change should put pressure on increased fossil fuel use, despite lower price • After interim period of “lower” prices, less than previous cycle, demand will to bump into supply limit again
Medium Term Prognosis • Nearest analogy to recent events is 1979-1985 period where price increased 350% (1979-1980) and dropped to 1978 level by 1985 • Demand reduction was 8% from peak (due to 1979-80 price rise and economic disruption) and world production dropped 15%, virtually all from OPEC • Stable price in this period should be around $60/Bbl as OPEC reduces production consistent with demand • Higher price fluctuations are possible due to use of oil as a “commodity hedge” • Major slowdown or halt in growth of “unconventional production” due to price and environmental factors
Short Term Prognosis • Demand destruction of 3.2% in 2008 has taken place in OECD, demand growth in 2008 has dropped to 3% in emerging nations and 1.5% in FSU. • Oil price fall has been arrested by OPEC taking the requisite amount off the market • OPEC cut of 3.5 MMBOD eliminated current overproduction. Other cuts (from shutting in marginal production, reduced investment and delayed or cancelled projects) will only be gradual.
Implications of next “Oil Crisis” for USA • ECONOMIC: Oil price rise played significant role in creating current crisis. Next price spike, possibly as soon as in 2-3 years, will break emerging recovery. • NATIONAL SECURITY: “Petro-states” such as Russia, Iran and Venezuela will be empowered. Role of oil in transportation cannot be quickly replaced. Import needs is strategic weakness. In each price spike, OPEC has higher proportion of world reserves and is in stronger position. • GREENHOUSE GASSES: Lower oil prices slow the economic impetus towards alternate energy sources. Danger that if Economic or National Security crisis hits too soon only alternative will be coal
Integrated Strategy needed for USA • ECONOMICS: Extend gap before next price spike as far as possible by reducing demand and encouraging internal supply • NATIONAL SECURITY: Reduce oil imports in every potential way, recognizing Economic and Environmental concerns • GREENHOUSE GASSES: Price of oil related energy must be high enough to encourage alternatives. Recognition that greenhouse gasses is worldwide problem that cannot be solved by just USA
Suggested tactics • Price imported oil significantly above domestic production. (import tax) This will be the best way to both reduce demand and preserve internal production. • Focus on natural gas as medium term “stop gap” as least environmentally harmful fossil fuel that USA has in abundance. This includes the transportation aspect. • Make East Siberia gas to China and Middle East gas to India foreign policy priority as best near term impact to reduce growing greenhouse gas emission • Set “floor (and possibly ceiling) price” on fossil fuel energy (different for coal, oil and natural gas) to allow stable investment climate for energy alternatives
Two of the most foolish statements of the past 100 years “Cheap Oil Forever” Newsweek, May, 2009 “Peace in Our Time” Neville Chamberlin, August, 1938