Download

1 / 40
400 likes | 554 Vues
Regulation of Glycogen Metabolism!!. Figure 18-22 The enzymatic activities of phosphorylase a and glycogen synthase in mouse liver in response to an infusion of glucose. Page 648. Figure 18-9 The control of glycogen phosphorylase activity. Page 635. Figure 18-13 Control of glycogen

E N D
Figure 18-22 The enzymatic activities of phosphorylase a and glycogen synthase in mouse liver in response to an infusion of glucose. Page 648
Figure 18-9 The control of glycogen phosphorylase activity. Page 635
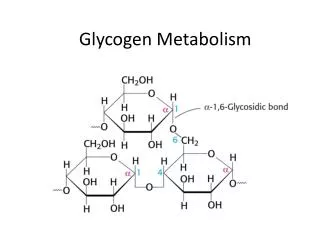
Figure 18-13 Control of glycogen metabolism in muscle. Page 639
Figure 18-16 X-Ray structure of rat testis calmodulin. Page 642
Figure 18-19 Schematic diagram of the Ca2+–CaM-dependent activation of protein kinases.
Figure 18-21 The antagonistic effects of insulin and epinephrine on glycogen metabolism in muscle. Page 645
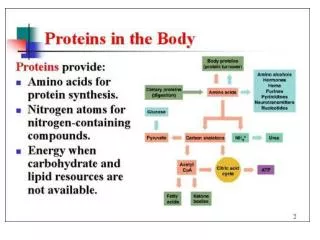
Maintaining Blood Glucose Levels • During exercise or long after meals, the liver releases glc into the bloodstream • Glc inhibits pancreatic -cells from secreting glucagon. Inhibition is released when glc levels fall. • Glucagon receptors on liver cells respond to glucagon binding by activating AC causing [cAMP]. • [cAMP] increases the rate of glycogen breakdown and increased G6P. • G6P cannot pass through cell membranes. However, the liver, which doesn’t rely on glc for a major energy source, has a G6P hydrolase to release glc.
Figure 18-23 Comparison of the relative enzymatic activities of hexokinase and glucokinase over the physiological blood glucose range. Page 649
Figure 18-24 Formation and degradation of -D-fructose-2,6-bisphosphate as catalyzed by PFK-2 and FBPase-2. Page 649
Figure 18-26a The liver’s response to stress. (a) Stimulation of -adrenoreceptors by epinephrine activates phospholipase C to hydrolyze PIP2 to IP3 and DAG. Page 652
Epinephrine and Norepinephrine • Mention 2,5 BFP
Figure 18-26b The liver’s response to stress. (b) The participation of two second messenger systems. Page 652
Figure 19-1a Classification of hormones. (a) Endocrinesignals are directed at distant cells through the intermediacy of the bloodstream. Page 658
Figure 19-1b Classification of hormones. (b) Paracrine signals are directed at nearby cells. Page 658
Figure 19-1c Classification of hormones. (c) Autocrine signals are directed at the cell that produced them. Page 658
Figure 19-2Major glands of the human endocrine system. Page 658
Table 19-1 (continued) Some Human Hormones – Polypeptides. Page 659
Table 19-1(continued) Some Human Hormones – Steroids. Page 659
Table 19-1 (continued) Some Human Hormones – Amino Acid Derivatives. Page 659
Fig. 19-16 Receptor-mediated activation/inhibition of Adenylate Cyclase
Figure 19-13 Activation/deactivation cycle for hormonally stimulated AC. Page 674
Figure 19-14 General structure of a G protein-coupled receptor (GPCR). Page 674
Figure 19-51 Role of PIP2 in intracellular signaling. Page 708
Figure 19-21 Schematic diagram of a typical mammalian AC. Page 682
Figure 19-50 Molecular formula of the phosphatidylinositides. Page 707
Figure 19-52 A phospholipase is named according to the bond that it cleaves on a glycerophospholipid. Page 709
Figure 19-57 Activation of PKC. Page 713
Figure 19-18a X-Ray structure of the hetero- trimeric G protein Gi. G subunit is violet with its Switch I, II, and III segments green, blue, and red, respectively Page 679
Figure 19-23 Domain organization in a variety of receptor tyrosine kinase (RTK) subfamilies. Page 684
Figure 19-27a Growth pattern of vertebrate cells in culture. (a) Normal cells stop growing through contact inhibition once they have formed a confluent monolayer. (b) In contrast, transformed cells lack contact inhibition; they pile up to form a multilayer.
Figure 19-28 Variation of the cancer death rate in humanswith age. Page 688
Figure 19-29a Transformation of cultured chicken fibroblasts by Rous sarcoma virus. (a) Normal cells adhere to the surface of the culture dish.(b) On infection with RVS, these cells become rounded and cluster together in piles. (a) (b) Page 689 Page 689
Figure 19-40 MAP kinase cascades in mammalian cells. Page 698