Download
1 / 32
320 likes | 413 Vues
The Louisiana Quadrangle Map Series. Sean Deinert and Sean Hodges GDM International Services, Inc. - Middleburg, VA. LTC 2013. New Orleans East USGS Quadrangle Map 1992. Mediterranean Sea Chart 1320 AD. Dutch Map of the World 1689 AD. Catalh ö y ü k, Turkey 6200 BC.

E N D
The Louisiana Quadrangle Map Series Sean Deinert and Sean Hodges GDM International Services, Inc. - Middleburg, VA LTC2013
New Orleans East USGS Quadrangle Map 1992 Mediterranean Sea Chart 1320 AD Dutch Map of the World 1689 AD Catalhöyük, Turkey 6200 BC Map of Babylon ca. 900 BC
Why Paper Maps Fell Flat… • Collection takes time • Production takes time • Updating is outpaced by real change • Inconsistent updating leads to inconsistencies • Costs to update outweigh benefit of the update
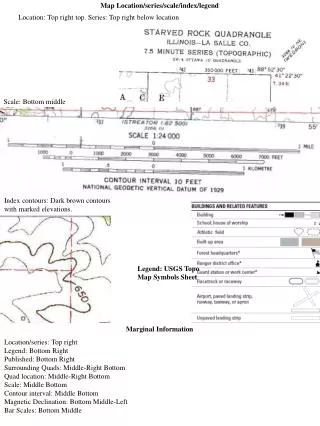
Paper Maps Do Not Edgematch As lines cross map boundaries they do not meet their counterpart on the next map.
Vertical Disintegration USGS maps are comprised of seven “framework themes” (water, elevation, transportation, boundaries, benchmarks, vegetation, and structures). USGS did not update all themes simultaneously. On this map, USGS has not updated the hypsography theme. So, the old elevation contours (brown) lie in the updated water (blue). The thick red lines show the photo-revised shoreline and other water features from the 2004 orthophotos.
Maps, Data, and Imagery Do Not Match The yellow lines are where best-available digital data show the land-water boundary. The image is post hurricane orthophotography. Neither match the maps.
How Up To Date are Louisiana’s Maps? • All paper maps are 5 years or older • 98% of paper maps are 10 years or older • 81% of paper maps are 15 years or older • 62% of paper maps are 20 years or older • 38% of paper maps are 25 years or older • The Catahoula Quad is 113 years old!
History of Mapping in Louisiana • 1928 – Act 159 of 1928 establishes topographic mapping authority • 2000 – The USGS ceases Topographic Map Program • 2002 – The National Map becomes USGS mapping priority • 2007 – USGS announced that it had no further work to complete in Louisiana • Aug. 2007 – DOTD partners with GDM International Services Inc to provide topographic mapping services for the State. • 2007 - The Louisiana Seamless GIS Basemap Project begins with 4 main goals: • Denote and acquire “best available” digital data from Local, State, and Federal sources • Assess, revise, and compile sources into Seamless GIS Basemap • Update National Hydrography Dataset watershed within project area • Create USGS-like Topographic Maps for distribution • 2010 – Act 782 of 2010 establishes La. R. S. 48:36 Topographic Mapping
Louisiana Act 782 of 2010La. R. S. 48:36 Topographic Mapping • Develop and maintain a statewide digital geospatial database • Act as authority for geographic names • Set standards for the mapping of topographic features • Plan and manage data collection for incorporation into a statewide database • Promulgate rules and regulations… as are necessary for the planning and managing of the geospatial data.
Program Mission • Support the geospatial information and technology requirements of LADOTD, Louisiana, and all other GIS users • Meet the “AAAAA” Data Standard • Accurate • Authoritative • Actionable • Accessible • Affordable • Establish and implement geospatial data standards, provide data access, management, and distribution
Better Sources Better Data 1:1,000 scale Lakeshore Drive, Baton Rouge 1998 Lakeshore Drive, Baton Rouge 2004 Lakeshore Drive, Baton Rouge 2005 Lakeshore Drive, Baton Rouge 2008 Lakeshore Drive, Baton Rouge 2010
Traditional Basemap Sources New Digital Database Format GNIS, Local Data USGS Quads, DOQQ Annotation BLM, Census, State Data Structures LA Seamless Database Boundaries Census, State Data Transportation USGS NHD Hydrography Contours LiDAR Vegetation Orthophotography Land Use BLM, Census, State Data
1998 Lower Vacherie Quad USGS 7.5’ Quadrangle • Features marked • Street locations • Building locations • What kind of school? • What type of student body? • Where is the school located?
2009 Lower Vacherie Quad LA DOTD 7.5’ Quadrangle • Features marked • Street locations • Building locations • Lower Vacherie Elementary School • Public, Pre-K - 8 • 13440 Highway 644, Vacherie, LA • Julie Dauzat, Principal
Where Has All The Coastline Gone? Red features are from the NHD. Orange polygons are areas represented by NOAA as land in 1940 (most current data). These are now open water in the NHD.
Lake Maurepas • First “Coastal Louisiana” experience – Pass Manchac
Final Results • Old methods • 60,000+ features revised • 8 months+ to update and revise • Manual table generation • New Methods • 31,000+ features revised • ~5 months to update and revise • Automated table generation
An Example: Studying the Economy • What does a high rate of foreclosures tell us? • It may tell us that an area is overpriced, or needs help bringing new • financing options to entice homebuyers. • Areas high in foreclosures or other vacancies may be areas to monitor • more closely, in an effort to reduce potential crime. • If the local economy is struggling, where can we best focus our resources? • Foreclosures tend to be in disrepair. Poor curb presence decreases • property values around the foreclosures themselves, further creating • problems. Lower property values = Economic stagnation. Agencies involved:
An Example: Katrina Aftermath • Which areas are still to be rebuilt? What problems exist? • Potential crime • Health hazards • Hurting industry • Losing ground, and it’s effects: • Affect the natural ecosystem of the State • Affect transportation routes, and State economy as a result • Loss of land invites further disaster Agencies involved:
Conclusions • The Basemap • Outdated basemaps are not doing anyone any favors. The maps are decades beyond their usefulness and need to be supplanted with newer technology • Converting traditional paper-based maps to computer-based GIS makes sense, both financially and in terms of potential usefulness • GIS seamless databases give us the opportunity to be freed from the grips of the traditional “quad” map • Enhancements • Using data that your agencies are already collecting, we can incorporate them into the new basemap and create new analyses • By combining information between agencies we can save TIME and MONEY