Download
1 / 1
10 likes | 126 Vues
Design of a Flow Chamber for Measuring Cell Membrane Permeability. Laura Dennis and Matthew Coblyn OSU School of CBEE, CHE 415-416. BACKGROUND. PROCESS DESCRIPTION. PROGRESS TO DATE.

E N D
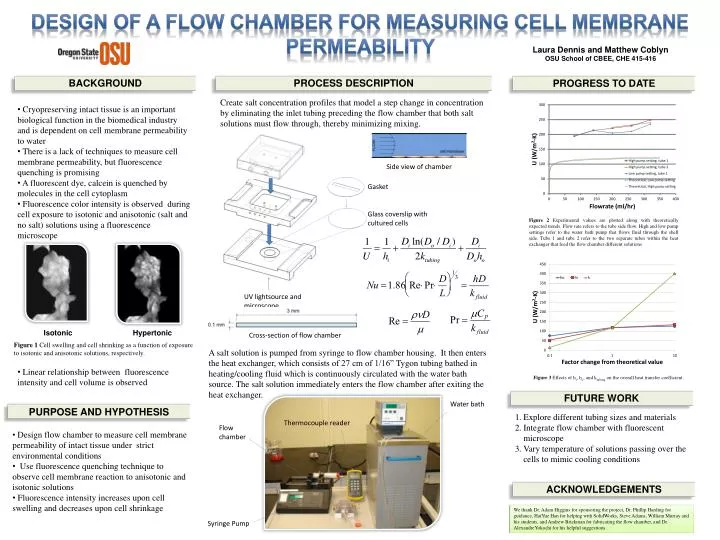
Design of a Flow Chamber for Measuring Cell Membrane Permeability Laura Dennis and Matthew Coblyn OSU School of CBEE, CHE 415-416 BACKGROUND PROCESS DESCRIPTION PROGRESS TO DATE Create salt concentration profiles that model a step change in concentration by eliminating the inlet tubing preceding the flow chamber that both salt solutions must flow through, thereby minimizing mixing. • Cryopreserving intact tissue is an important biological function in the biomedical industry and is dependent on cell membrane permeability to water • There is a lack of techniques to measure cell membrane permeability, but fluorescence quenching is promising • A fluorescent dye, calcein is quenched by molecules in the cell cytoplasm • Fluorescence color intensity is observed during cell exposure to isotonic and anisotonic (salt and no salt) solutions using a fluorescence microscope • Linear relationship between fluorescence intensity and cell volume is observed Side view of chamber Gasket Glass coverslip with cultured cells Figure 2 Experimental values are plotted along with theoretically expected trends. Flow rate refers to the tube side flow. High and low pump settings refer to the water bath pump that flows fluid through the shell side. Tube 1 and tube 2 refer to the two separate tubes within the heat exchanger that feed the flow chamber different solutions UV lightsource and microscope Isotonic Hypertonic Cross-section of flow chamber Figure 1 Cell swelling and cell shrinking as a function of exposure to isotonic and anisotonic solutions, respectively. A salt solution is pumped from syringe to flow chamber housing. It then enters the heat exchanger, which consists of 27 cm of 1/16” Tygon tubing bathed in heating/cooling fluid which is continuously circulated with the water bath source. The salt solution immediately enters the flow chamber after exiting the heat exchanger. Figure 3 Effects of hi, ho, and ktubing on the overall heat transfer coefficient. FUTURE WORK Water bath PURPOSE AND HYPOTHESIS Explore different tubing sizes and materials Integrate flow chamber with fluorescent microscope Vary temperature of solutions passing over the cells to mimic cooling conditions Thermocouple reader Flow chamber • Design flow chamber to measure cell membrane permeability of intact tissue under strict environmental conditions • Use fluorescence quenching technique to observe cell membrane reaction to anisotonic and isotonic solutions • Fluorescence intensity increases upon cell swelling and decreases upon cell shrinkage ACKNOWLEDGEMENTS We thank Dr. Adam Higgins for sponsoring the project, Dr. Phillip Harding for guidance, HaiYue Han for helping with SolidWorks, Steve Adams, William Murray and his students, and Andrew Brickman for fabricating the flow chamber, and Dr. AlexandreYokochi for his helpful suggestions. Syringe Pump