Download
1 / 5
50 likes | 171 Vues
North Atlantic Oscillation: Recent Trends and Global Impacts Todd Crawford Principal Scientist Decision Support Group WSI Corporation The Weather Channel Companies. North Atlantic Oscillation (NAO). NAO describes the strength of the polar vortex Strong vortex (pos NAO) =

E N D
North Atlantic Oscillation: Recent Trends and Global Impacts Todd Crawford Principal Scientist Decision Support Group WSI Corporation The Weather Channel Companies
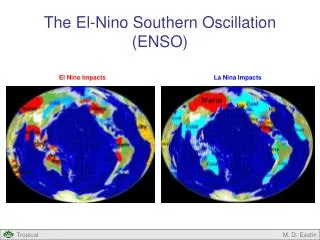
North Atlantic Oscillation (NAO) • NAO describes the strength • of the polar vortex • Strong vortex (pos NAO) = • stronger Atl jet stream • Weak vortex (neg NAO) = • N Atl blocking, tapping Arctic air • Winter 2009-10 had record • low (negative) NAO
Long-term decline in NAO • Sensible impacts of neg. NAO • Cooler northern US summers • Cooler eastern US winters • Cooler northern Eur summers • Cooler northern Eur winters • Fewer European windstorms • More hurricane landfalls in • Northeast US Recent patterns more like those in 1950s and 1960s
Aggregate impacts of negative NAO in US and Europe SUMMER WINTER
Negative NAO impact on hurricane landfall rates • Sorted 1950-2009 August-October NAO values • For strongest 20 neg/pos NAO years: • Significantly increased landfall rates in Northeast during neg NAO • Significantly decreased landfall rates in western Gulf during neg NAO