Download
1 / 22
220 likes | 409 Vues
SEZs in India : A Quantitative Assessment of Costs and Benefits. Aradhna Aggarwal Associate Professor Department of Business Economics University of Delhi Consultant : ICRIER aradhna.aggarwal@gmail.com. Contents. The Rationale Benefits and costs: Theoretical approaches

E N D
SEZs in India :A Quantitative Assessment of Costs and Benefits • Aradhna Aggarwal • Associate Professor • Department of Business Economics • University of Delhi • Consultant : ICRIER • aradhna.aggarwal@gmail.com
Contents • The Rationale • Benefits and costs: Theoretical approaches • Net Benefits: A quantitative assessment • Benefits and costs : Qualitative analysis • Conclusion
Why SEZs? Two approaches Orthodox Approach ( neo classical) Heterodox approach (New institutional theories) SEZs offer relaxed tax and custom regime and offset anti-export bias in import substituting regime Offer good I climate in export oriented regime tax incentives : Modern Infrastructure Good Governance Location-specific advantages Promotion of EOI Earning foreign exchange
EOI is promoted through… Three channels • Domestic producers: • Independent producers • Insertion into GVCs • (Small firms) • Seller driven • Buyer driven MNCs Intra-firm trade Clustering
Promoting manufacturing is important in India because… • Service-sector driven growth. Employment generation potential is limited. • The share of manufacturing remains almost constant at 16-17%. • Evidence suggests that employment growth in the formal sector declined. • Agriculture contributes less than 20% but over 60% people are dependent on agriculture and allied activities. • A case study of Faizabad : 5 families multiplied to 300 families over time, cultivable land remains 1100 acres. No “break even” in many cases. Villagers are looking for alternative employment opportunities. • There is need to improve investment climate to promote manufacturing but resources limited. • Evidence suggests that zones can play an important role in attracting investment and promoting exports and industrialisation.
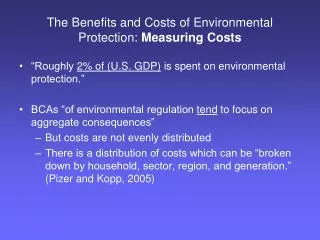
Benefits to the economy: Theoretical approaches • 1. Orthodox Approach (Neo classical): • to offset anti-export bias in a heavily regulated economy : • always welfare reducing • 2. Cost benefit approach (accounting method) :Warr, 1989 • SEZs have both costs and benefits. • Their contribution depends on whether measurable costs are less than measurable benefits. • Recognised indirect benefits in terms of income generated • These arise from backward and forward linkages but argued that they are limited. • 3. Heterodox approach (Johansson 1994) • Underscored the importance of indirect effects through spillovers and demonstrations. • Overall effects are difficult to measure • Aggarwal (2007) : Spillovers also take place when • Zones’ entrepreneurs interact with the rest of the economy entrepreneurs in various forums. • Zone entrepreneurs set up production units outside the zones.
Benefits : The Eclectic approach Indirect Direct • Foreign exchange • Employment generation • Employment for Females • Skill Upgradation • FDI • Tech. transfers and creation • Indirect employment • Investment • Skill spillovers • Technology spillovers 1. Ind. growth 2. Productive Diversification 3. Human development 4. Revenue generation for govt. Non quantifiable : other direct and indirect effects Quantifiable : static :Foreign Ex earnings, Net value addition, I, employ, Dynamic : Income generation
Costs • Quantifiable: • 1. SEZ development cost : Not incurred by the government • 2. Revenue loss (Tax and other investment incentives) • 3. Operational costs Other welfare costs : Non quantifiable • Resource transfer from the domestic sector to SEZs with no net addition to economic activities ( relocation and substitution effect) • Land Acquisition without adequate compensation • Impoverishment of farmers • Loss of agricultural land • Misuse of land for real estate • Regional disparities • Unequal treatment
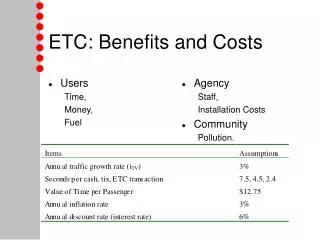
Net benefits • NNB = (EXP+DTA+TAXGAIN)-IMP-RM-ELEC-ADMIN-TAX LOSS • Where • NNB: Net benefits from SEZs • EXP : foreign exchange earnings and • DTA : Domestic Tariff area Sales • TAXGAIN: Taxes collected on DTA sales • EXP+DTA+TAXGAIN: Total benefits • IMP : imports • ELEC : the cost of public utilities (electricity, power and fuel) • RM : the cost of locally purchased inputs • TAX Direct and indirect ( only for SEZ developers) tax foregone • ADMIN: Administrative costs • IMP+ELEC+RM+TAX+ADMIN : total cost
Fundamental assumptions: • The proposed SEZ investment in each of the three years will be Rs. 100,000 cr. • The actual investment in each year will follow a three years’ time frame. In other words, realized investment in the first year will be 50% of the proposed investment in that year say, t. In the second (t+1) year, 30% and in the third (t+2) year , 20% of the investment proposed in the year “t” will be realized. • Of the total investment, 7% is projected to occur in the FTWZ /power SEZs in each year. The remaining will be invested in other zones. • The infrastructure development expenditure in new SEZs will be 60% of the total investment in the first year. In the second and the third year it will be 30% and 10%. • The remaining investment termed “productive investment” is divided between the IT sector and other sectors in the proportion of 44% in the first year, 42% in the second year and 40% in the third year. • We required several other conduct and performance related ratios which are based on the CMIE database of the export oriented sector. Data was extracted for the relevant industries.
Tax losses and benefits generated as proportion of incremental investment
National Contribution to exports, employment Regional development Contribution to employment, Income generation Ancilliary industrial activities Most notable : SEEPZ, CSEZ, Kandla, Noida At the sector level significant contribution to technology transfer, spill overs and development of Local entrepreneureship : Gems and Jewellery, Electronics, SW, rubber gloves Contribution of EPZs to Industrial growth/diversification : A qualitative analysis
Technology Transfers, creation. And Spillovers limited Skill formation : Industrial Training, improvement in skill, Better prospects outside. Remunerative employment for people with low Education level: : comparable wages and Better working conditions, satisfaction levels are higher Living conditions improved after joining the EPZs Human development and Poverty
SEZ Act provides a major thrust • 1. A well balanced package of incentives, infrastructure, governance is offered. • Should tax incentives be offered: • Yes, Our survey-based study shows that • The most important ingredient in any SEZ policy is :Tax incentives • Three reasons: • Export obligations, attachment with GVC, no location choice. • Second most important factor: good governance : custom rules and single window clearance. • Third: infrastructure : within zones: electricity and water; outside zones: transport, roads, ports and airports • Fourth : location. If good external infrastructure, this is not important. The argument that they should be set up only near the ports is not sustainable.
SEZ Status Investment Employment (No.) Nokia, Tamil Nadu: commenced commercial production US$ 100 Million Direct : 2800 Indirect : 10000 Quark City, Chandigarh: Inaugurated by the PM $ 0.5 billion FDI* 35000* by May 2007 Flextronix in Tamilnadu Commences operation in November 2006 $100 million 3000* (2500 under training) Motorola and Foxconn, Tamilnadu Units being set up $200 million* 5000* by Dec. 2007 Apache SEZ (Adidas Group), Andhra Pradesh Construction started $50 million* 25,000* Divvy’s Labs, Andhra Pradesh Commenced operations NA 8000* by April 2007 Rajiv Gandhi Technology Park, Chandigarh Construction started NA 5000* by June 2007 (500 under training) Brandix Apparel SEZ, Andhra Pradesh Advanced stage of construction $100 million* 26000* by March 2007 Current status *Expected
Recent patterns • Formal approvals : 234 as on May 1, 2007 • AP : 45, Maharashtra : 47, Tamilnadu : 25, Karnataka : 29, Haryana and Gujrat : 19 each, Kerala 10, UP 8. WB: 7,MP : 4 • IT : 133, Electronic HW and SW : 16; 10 multi products; 12 Pharmaceuticals, 9 bio tech, over 11 textile • In principle approvals : 164 • Notified as on 1st May 2007: 100 • High tech industries that have come up due to SEZs: • Electronics Manufacturing Services, Semiconductor, Aerospace, • Other industries benefited : Biotech, Pharmaceutical, automobile, textile.
Costs : A qualitative Analysis • Relocation : Misplaced. but in the IT sector substitution effect is evident • Land Acquisition : Needs serious research, should not be left to the private parties. • Loss of agricultural land : Need to create “land bank” along the lines of TN. • Impoverishment of farmers : Needs research. But sharp rise in land prices, Huge compensations, They must be offered specifically designed investment plans for these funds to ensure regular incomes. This may provide them security. • Misuse of land for real estate : Need for exit policy and regular monitoring • Uneven growth : misplaced • Unequal treatment with exporters : Tax incentives to STPIs and EOUs. • A large number of IT sector SEZs : Once STPI incentives restored, this issue will be addressed.
Conclusion • SEZs can act as catalyst to industrial growth provided they are implemented effectively. • Effective implementation of a policy that aims at giving shock to the economy requires mobilization of public opinion. People often approach such an issue initially with strong, emotionally laden feelings and opinions. It must be shaped and formed so that important decisions are taken without creating instability in the society. • Four things are important : • The government must slow down the process of giving approvals. This is important not only for social or political reasons but also due to economic realities. • Legal institutions related to land acquisition ( including land acquisition modalities, compensation package and rehabilitation package) must be addressed. • Introduce a performance based exit policy for SEZ developers • Restore STPI and EOUs benefits • Finally, the policy should be treated as transitory.