Download
1 / 14
140 likes | 261 Vues
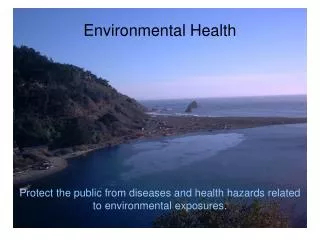
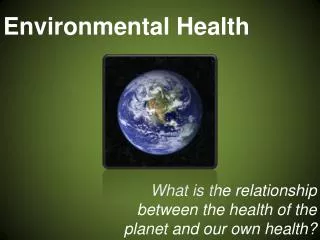
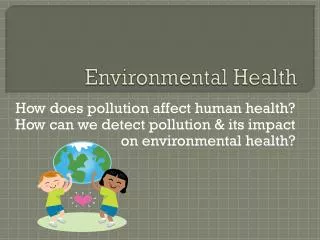
Dorchester Environmental Health Coalition. Air Quality Testing | Dorchester Avenue. Why did we test?. To find out: The effect of construction on Dorchester Ave. How healthy is the air before and after? Find out which areas are most likely to be polluted

E N D
Dorchester Environmental Health Coalition Air Quality Testing | Dorchester Avenue
Why did we test? • To find out: • The effect of construction on Dorchester Ave. • How healthy is the air before and after? • Find out which areas are most likely to be polluted • How future construction projects will affect air quality in Dorchester • Where we can make changes in the environment to improve air quality, using what we’ve found out
Where did DEHC test? • Columbia Road and Dorchester Avenue, near the JFK/UMass Station • Dorchester Avenue, near Freeport and Hancock streets • Fields Corner, West to Ronan Park and East to Clayton Street • Lower Mills, West to Washington and River streets and East to Adams Street and Butler Station
Why those areas? • Mix of high-traffic and residential areas • Near schools and civic landmarks • Wanted to see if green areas affect air quality
How did DEHC test the air? • Tested for ultra-fine particles (UFP) • UFPs are smaller than 100 nanometers (one billionth of a meter) • Both manufactured and naturally occurring • Examples: smoke, ocean spray, cooking fumes, automobile exhaust • UFPs are a health hazard in large quantities because they can penetrate deep into the lung • We count UFPs in the air by using a P-TRAK machine.
How the P-TRAK works • *The P-TRAK is a condensation particle counter • A pump sucks air into the P-TRAK, where the air mixes with alcohol vapor • The particles and alcohol are then sucked into a tube where alcohol condenses on the particles • The particles mixed with alcohol are then passed through a focused laser beam, creating flashes of light • The flashes of light are then counted to determine particle concentration. *http://www.bis.fm/products/TSI_PTRAK_Ultrafine_Particle_Counter.asp
What we know about UFPs • *There is no standardization on ultra-fine particles at the moment. Nevertheless, it is possible to give some reference concentrations. • Measured in concentrations of particles/cm3. • Clean air in the alps < 1,000 • Clean office air 2,000 – 4,000 • Outside Air in urban area 10,000 – 20,000 • Polluted outside air (smog) > 50,000 • Cigarette smoke > 50,000 • Workplaces (like welding) 100,000 – 1,000,000 *http://www.aerasense.com/index.php?pageID=5#4
Our Data: Testing Conditions • We tested each route 6 times, thrice in the morning, thrice in the afternoon • 8a.m. – 9:30a.m., 3:30p.m. – 5 p.m. • One minute intervals • Five minutes per stop
Columbia/Savin Hill Minimum: 5,914 ; Maximum: 39,012; Average: 12,238
Fields Corner Minimum: 15,181 ; Maximum: 89,415; Average: 28,319
Glover’s Corner (Freeport/Hancock) Minimum: 8,847; Maximum: 39,245; Average: 15,561
Lower Mills Minimum: 7,095; Maximum: 29,735; Average: 11,616
What does this data mean? • The data for each stop is different depending on the time of day, weather, and traffic levels • To find out which areas are affected by unhealthy levels of UFPs, we: • Average data for each stop on the route • Eliminate outliers
In the future… • DEHC will have analyzed this data and continued the project in: • Peabody Sq., Washington St., Columbia Rd., Massachusetts Ave., Blue Hill Ave. and Bowdoin St. • DEHC will make recommendations for future construction projects in Dorchester • DEHC will continue with projects such as the Community Assessment of Freeway Exposure & Health • DEHC will take measures to: • Reduce exposure to unhealthy levels of UFPs • Re-design road projects to lower UFP emissions