Download
1 / 1
30 likes | 355 Vues
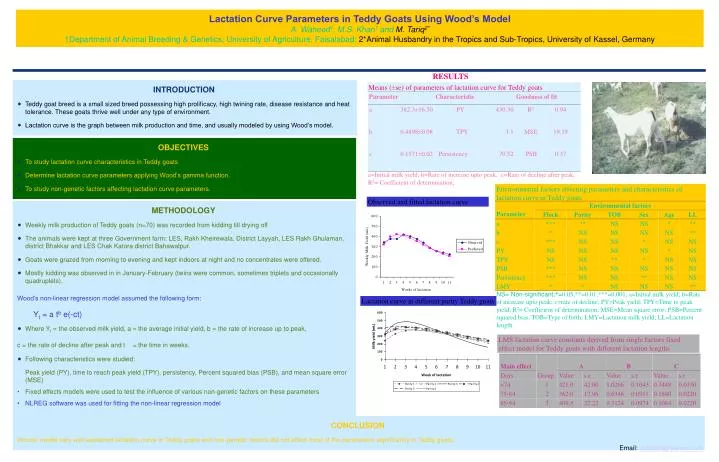
Lactation Curve Parameters in Teddy Goats Using Wood’s Model A. Waheed 1 , M.S. Khan 1 and M. Tariq 2* 1Department of Animal Breeding & Genetics, University of Agriculture, Faisalabad; 2* Animal Husbandry in the Tropics and Sub-Tropics, University of Kassel, Germany. RESULTS. INTRODUCTION

E N D
Lactation Curve Parameters in Teddy Goats Using Wood’s Model A. Waheed1, M.S. Khan1 and M. Tariq2* 1Department of Animal Breeding & Genetics, University of Agriculture, Faisalabad; 2*Animal Husbandry in the Tropics and Sub-Tropics, University of Kassel, Germany RESULTS INTRODUCTION • Teddy goat breed is a small sized breed possessing high prolificacy, high twining rate, disease resistance and heat tolerance. These goats thrive well under any type of environment. • Lactation curve is the graph between milk production and time, and usually modeled by using Wood’s model. Means (±se) of parameters of lactation curve for Teddy goats OBJECTIVES • To study lactation curve characteristics in Teddy goats • Determine lactation curve parameters applying Wood’s gamma function. • To study non-genetic factors affecting lactation curve parameters. a=Initial milk yield; b=Rate of increase upto peak; c=Rate of decline after peak; R2= Coefficient of determination; Environmental factors affecting parameters and characteristics of lactation curve in Teddy goats Observed and fitted lactation curve METHODOLOGY • Weekly milk production of Teddy goats (n=70) was recorded from kidding till drying off • The animals were kept at three Government farm: LES, Rakh Kheirewala, District Layyah, LES Rakh Ghulaman, district Bhakkar and LES Chak Katora district Bahawalpur. • Goats were grazed from morning to evening and kept indoors at night and no concentrates were offered. • Mostly kidding was observed in in January-February (twins were common, sometimes triplets and occasionally quadruplets). NS= Non-significant;*=0.05;**=0.01;***=0.001; a=Initial milk yield; b=Rate of increase upto peak; c=rate of decline; PY=Peak yield; TPY=Time to peak yield; R2= Coefficient of determination; MSE=Mean square error; PSB=Percent squared bias, TOB=Type of birth; LMY=Lactation milk yield; LL=Lactation length Wood’s non-linear regression model assumed the following form: Yt = a tb e(-ct) • Where Yt = the observed milk yield, a = the average initial yield, b = the rate of increase up to peak, c = the rate of decline after peak and t = the time in weeks. • Following characteristics were studied: Peak yield (PY), time to reach peak yield (TPY), persistency, Percent squared bias (PSB), and mean square error (MSE) • Fixed effects models were used to test the influence of various non-genetic factors on these parameters • NLREG software was used for fitting the non-linear regression model Lactation curve in different parity Teddy goats LMS lactation curve constants derived from single factors fixed effect model for Teddy goats with different lactation lengths CONCLUSION Woods’ model very well explained lactation curve in Teddy goats and non-genetic factors did not affect most of the parameters significantly in Teddy goats. Email: dobaara@yahoo.com