Download
1 / 28
280 likes | 362 Vues
NUMERICAL TERRAIN MODEL IN SPATIAL PLANNING. GRID DATA FORMAT.

E N D
NUMERICAL TERRAIN MODEL IN SPATIAL PLANNING
This kind of “layer” is created by the regular fields net that have strictly determined size of the cells. Each of the cell possesses attributed value (numerical or qualitative). The structure of the grid data is in this case analogical to the raster data. (0,0) x P1 : (1,1) – 1234 (wartość RGB) P2 : (2,1) – 1234 P3 : (3,1) – 1652 P4 : (1,2) – 1021 P5 : (2,2) – 1652 P4 : (3,2) – 1021 P1 P2 P3 P4 P5 P6 y
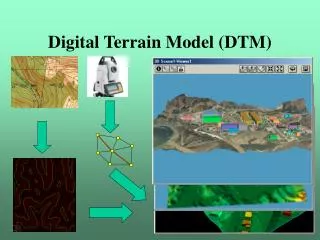
An example of this kind of data are geophysical fields of: temperature, pressure, precipitation as well as elevation above the sea level (known as the digital terrain model – DEM or numerical terrain model - NMT)
Case 1. The delimitation of the potential skiing areas within the south part of the Kashubian Landscape Park
The following grid layers were “extracted” from the digital elevation model: • - slope reduction • - slope exposure • - relative height
the following classified grid layers were derived from vector data: - landuse - distance from existing roads
“Choosing area” - questions basing on the defined conditions. The conditions were provided to choose the area which has the best natural skiing condition.
As the result, 5 potential skiing areas (fulfilling all conditions listed above) were delimited. These regions are listed below: • Przyrowie – Borzestowo (Chmielno and Stężyca gminas); • Borzestowska Huta – Chmielno (Chmielno gmina); • Ostrzyce – Brodnica Dolna (Somonino and Kartuzy gminas); • Krzeszna – Golubie (Stężyca gmina); • Kamienica Szlachecka (Stężyca gmina).
The results Tereny predysponowane do rozwoju narciarstwa Tereny predysponowane do rozwoju narciarstwa
Potential skiing area limited this way within the south part of the Kashubian Landscape Park is around 2300 ha large. This area includes skiing area Krzeszna-Golubie, the only skiing area with ski lifts in this part of Kashubia so far. This fact confirms presumed conditions and the whole analysis as well.
Case 2. Determining the areas of potential ground water pollution
using mathematical operation (subtraction) on two grid layers: digital elevation model and underground-water level (height above the sea level) the thickness of aeration strata was calculated and the areas of different level of isolation from the ground surface were determined.
Aeration zone depth grid – the result of the grid calculation derived from DTM and water level grid layers
Basing on diversity of thickness of the aeration zone (the degree of isolation), 5 categories of underground waters’ isolation against pollution danger were specified: • very poor (aeration zone depth under 5 m); • poor (aeration zone depth 5 - 10 m); • middle (aeration zone depth 10 - 25 m); • good (aeration zone depth 25 - 50 m); • very good (aeration zone depth above 50 m);
Case 3. Determining the changes of surface runoff caused by land-ude changes (realisation of the spatial development plans)
Conclusions: • The usage of the NMT and the grid data format can be very useful in spatial planning. • The increasing number of spatial data – including raster grid format and vector format – enabling interpolation or conversion into grid format – stored and made accessible in Regional Centres of Geodesic and Cartographical Documentation, creates a positive vision of future usage of GIS in this field.